
Figure 1.
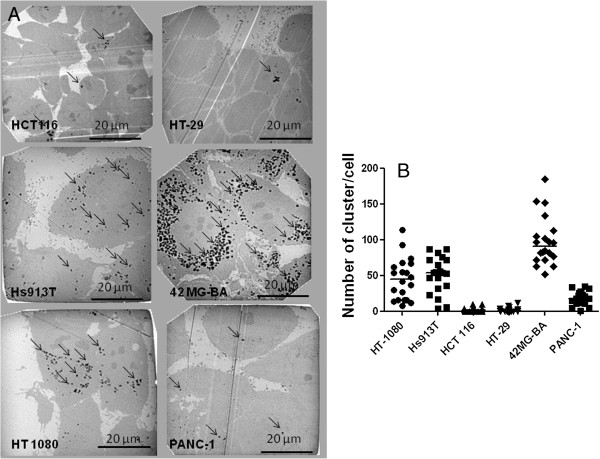
Semi quantitative analysis of NBTXR3 nanoparticles cellular uptake. Cells were treated with NBTXR3 overnight. (A) representative TEM images (NBTXR3 400 μM) for mesenchymal (Hs913T, HT-1080), epithelial (HCT 116, HT-29, PANC-1) and glioblastoma (42-MG-BA) cells showing clusters of nanoparticles in endosomes (black arrows) and (B) scatter plot and median value presenting the number of NBTXR3 nanoparticles’ clusters per cell. Scale bars = 20 μm.