
Figure 5.
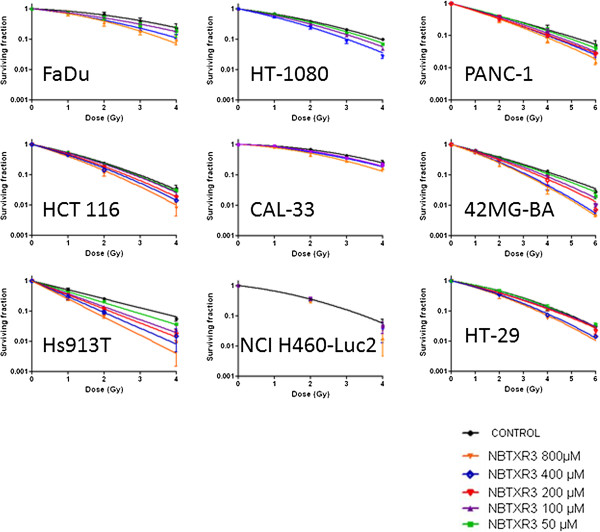
Cell survival curves. Human cancer cells were treated with increasing concentration of NBTXR3 nanoparticles overnight before being exposed to radiation. Symbols represent mean surviving fraction (mean SF ± SD). The data (mean SF) were fitted with the LQ model equation to estimate the α and β parameters.