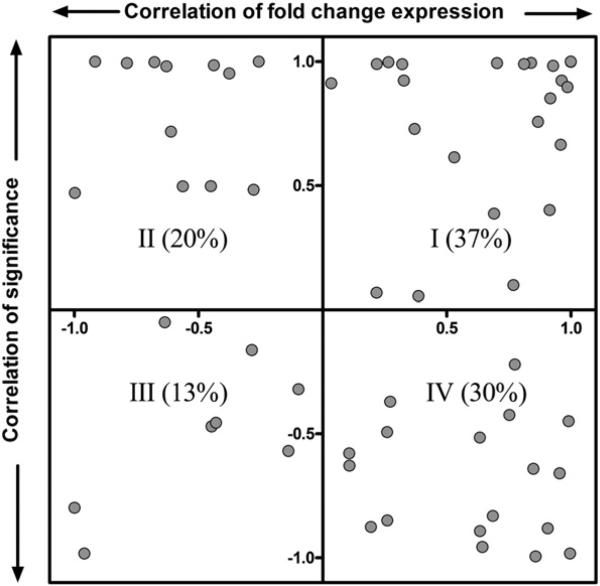
Fig. 4.
Correlation analysis of commonly regulated TCDD-responsive genes (|fold change|≥1.5, P1(t)≥0.99). Gene annotation for the rat Affymetrix dataset was first updated using Affymetrix release 32 annotation (http://www.affymetrix.com/support/help/releasedocs/netaffx_release_32.affx). The updated rat Affymetrix GeneChip 230 2.0 and the mouse 4×44K Agilent oligonucleotide array (version 1) raw datasets were normalized by a semiparametric method (Eckel et al., 2005), and statistically analyzed using an empirical Bayes method (Eckel et al., 2004). Only 37% genes were positively correlated in terms of fold change and significance between rat and mouse genes (quadrant I).

