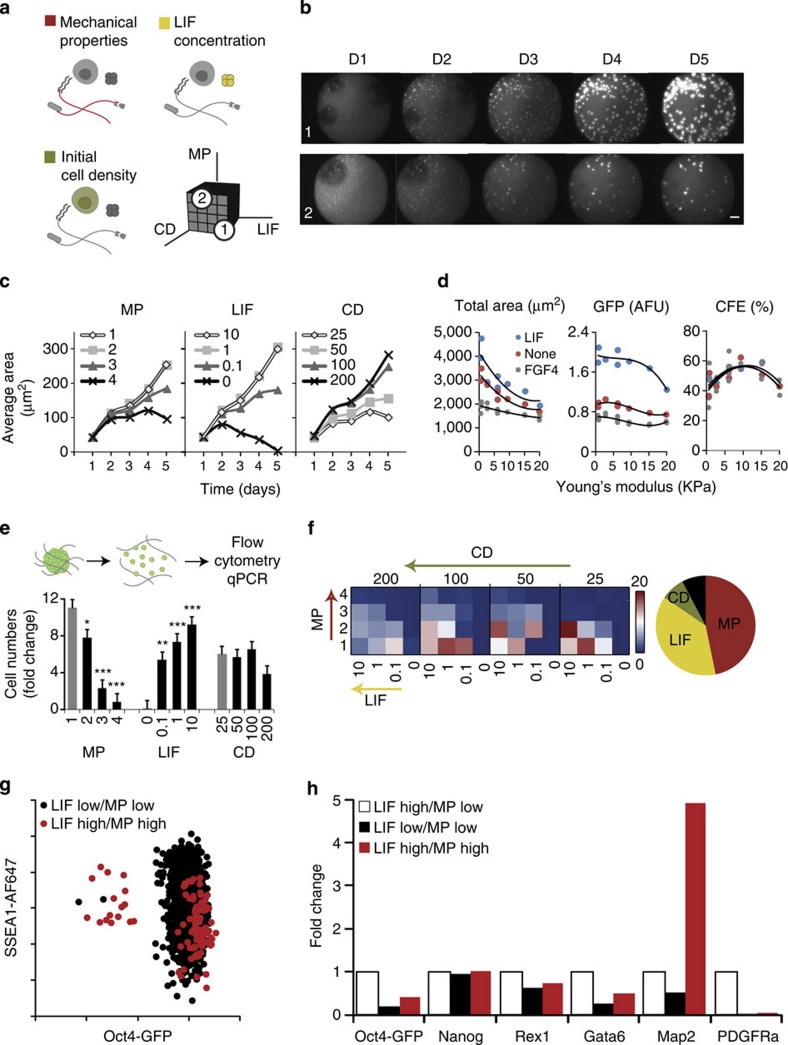
Figure 4. Downstream cell assays are compatible with 3D gel microarray approach.
(a) In a targeted screen, 4 levels of 3 factors are combined for a total of 64 unique conditions with multiple replicates. Mechanical properties are varied from 200 to 2,000 Pa (Young’s modulus E), LIF concentration varied from 103 to 10 U ml−1 (with negative control 0 U ml−1) and cell density varied from 25 to 200 cells per μl. (b) Images are taken every day, allowing for the observation of the evolution of colony growth over time in all conditions—here two selected conditions are shown: both start with an initial cell density of 200 cellsper μl; for condition 1: LIF=103 U ml−1, MP=200 Pa (soft); for condition 2: LIF=10 U ml−1, MP=2,000 Pa (stiff). (c) After image analysis, measures such as average colony area can be assessed over time. (d) Average colony area, GFP intensity and colony-forming efficiency are shown as a function of the measured stiffness for three soluble factor regimes. (e) Dissociation of the hydrogel matrices in each well allows a quantification and phenotyping of cells by flow cytometry and other downstream assays. (f) Heatmap representation indicating a clear trend towards a graded bidirectional influence of LIF and MP, an observation reinforced by the global analysis. (g) Differences between specific conditions of interest can be further investigated by analysis of surface marker expression or (h) PCR analysis of genes involved in self-renewal and differentiation into early germ layer. Fold change here is with respect to the baseline LIF high/MP low condition (n=3 biological replicates). Scale bar, 200 μm. Error bars represent s.e.m. All pairwise differences were computed using the Tukey–Kramer method. ***P<0.001, **P<0.01, *P<0.05.

