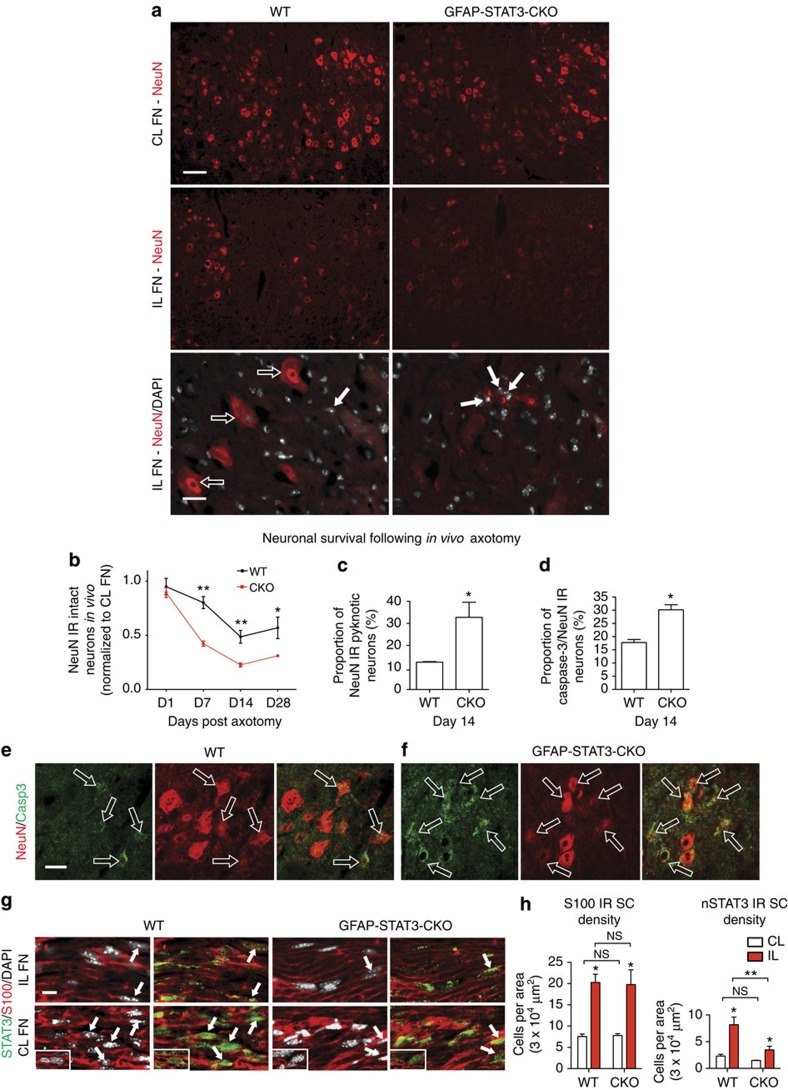
Figure 3. Neuronal integrity is maintained in areas of full AC activation in vivo.
(a) Fluorescent microscopic images of NeuN IR neurons in the CL and IL FN in brain sections from WT and CKO mice 14 days after facial nerve transection. DAPI-stained pyknotic neuronal nuclei are present in the IL FN (full arrows) among intact neurons (empty arrows). (b) Relative number of intact and strong NeuN IR neurons at days 1, 7, 14 and 28 post axotomy (n=3, 3; 4, 4; 7, 7; 4, 3 mice for WT, CKO groups, two-way analysis of variance (ANOVA) P<0.0001, F(1/24)=23.72 for the genotype effect, **P=0.0026, **P=0.0029, *P=0.044, respectively, t-test for pairs). (c) Mean percentages represent the proportion of neurons undergoing pyknosis (n=3 mice, *P=0.041, t-test) and (d) the proportion of NeuN IR neurons that are also positive for activated caspase-3 labelling (n=3 mice, *P=0.025, t-test). (e,f) Examples of activated caspase-3/NeuN IR neurons in the IL FN of WT and CKO mice. (g) Axotomized and also CL facial nerves sampled close to the stylomastoid foramen 1 mm away from the nerve stump. Images show nuclear localization of STAT3 (nSTAT3, arrows) in S100-positive SCs in both WT and CKO mice. Insets represent confocal microscopic images. (h) Means of density values (cells per area) for the total number of S100-positive cells and for nSTAT3/S100 double-labelled cells in the intact CL and axotomized nerves (n=3 mice, *P<0.05, **P=0.002, one-way ANOVA P=0.0016). Scale bar, 100 μm and 25 μm for a; 30 μm for e,f; 10 μm for g and for insets. Data represent mean±s.e.m.

