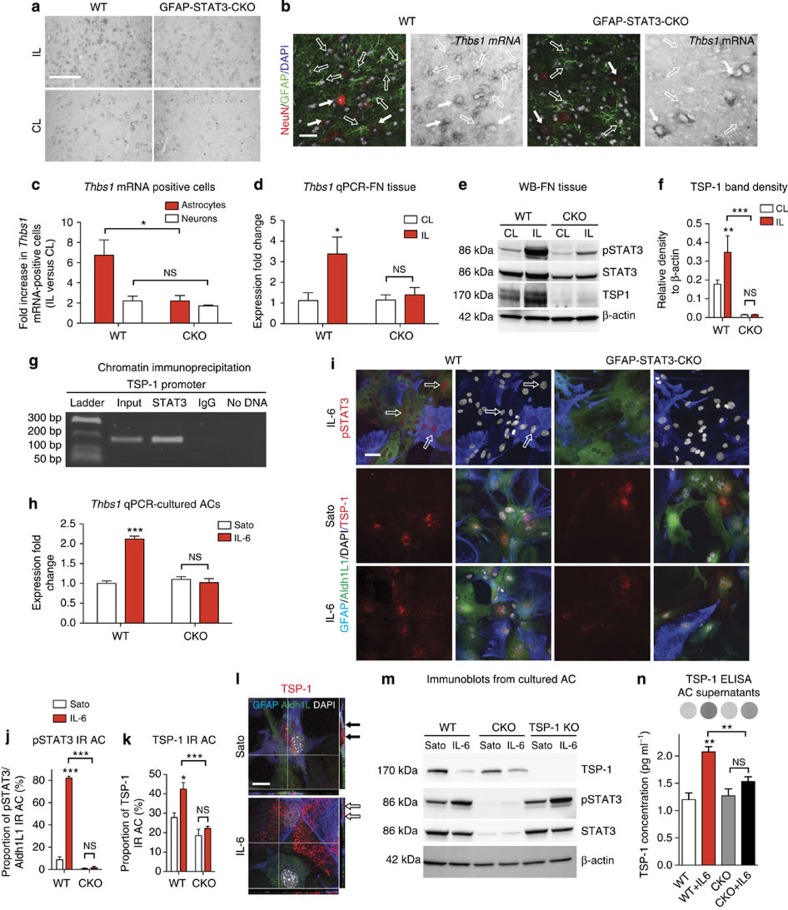
Figure 7. STAT3 activation directly regulates TSP-1 expression in ACs.
(a,b) In situ hybridization for Thbs1 in the FN 7 days post axotomy in WT and CKO mice. (b) Triple-labelling shows co-localization of Thbs1 mRNA with GFAP (empty arrows) or NeuN immunoreactivity (arrows). (c) Quantification of ACs and neurons expressing Thbs1 mRNA (n=3 mice, *P=0.039, NSP=0.407, t-test). (d) Thbs1 mRNA measured by qPCR in IL and CL FN tissue samples in WT and CKO mice at day 14 (n=3, *P<0.05, one-way analysis of variance (ANOVA) P=0.035). (e) Immunoblots of samples taken from FN tissues at day 14, representing TSP-1 content against pSTAT3, STAT3 and β-actin immunoreactivity. (f) Mean density values for TSP-1 immunoblots of IL and CL FN (n=3, **P<0.01, ***P=0.0002, one-way ANOVA). (g) ChIP demonstrates specific STAT3 binding to the TSP-1 promoter by showing PCR product enrichment in the STAT3 pull-down sample. Positive control: sonicated/non-precipitated input sample. Negative controls: normal rabbit immunoglobulin G and ‘No DNA’ samples. (h) Thbs1 mRNA levels measured by qPCR in purified WT (n=3) and CKO AC cultures (n=6) with or without IL-6 treatment (***P<0.001, one-way ANOVA P<0.001). (i) Aldh1L1/GFAP/DAPI- and pSTAT3 or TSP-1 quadruple labelling in WT and CKO ACs activated by IL-6 or in serum-free conditions (Sato). Proportion of GFAP/Aldh1L1 IR ACs displaying (j) pSTAT3 (empty arrows) or (k) TSP-1 immunoreactivity in Sato and IL-6-activated conditions (n=3 experiments per replicate cultures, ***P<0.001, *P<0.05, one-way ANOVA P=0.0012). (l) Confocal images illustrating intracellular or extracellular distribution of TSP-1 immunoreactivity in non-activated or IL-6-treated WT ACs, respectively. (m) TSP-1, pSTAT3 and STAT3 immunoblots for WT, CKO and TSP-1 KO ACs treated with Sato or IL-6. (n) ELISA: mean concentrations of TSP-1 (pg ml−1) released into supernatants by WT and CKO ACs after treatment with Sato or IL-6. Dots represent chemiluminescence (n=3 experiments per replicate samples, **P<0.01, one-way ANOVA P=0.002). Scale bar, 200 μm for a; 50 μm for b; 40 μm for i; 20 μm for l. Data represent mean±s.e.m. Supplementary Figs 2–4.

