
Extended Figure 4. Probing the contribution of alternative NADPH producing pathways.
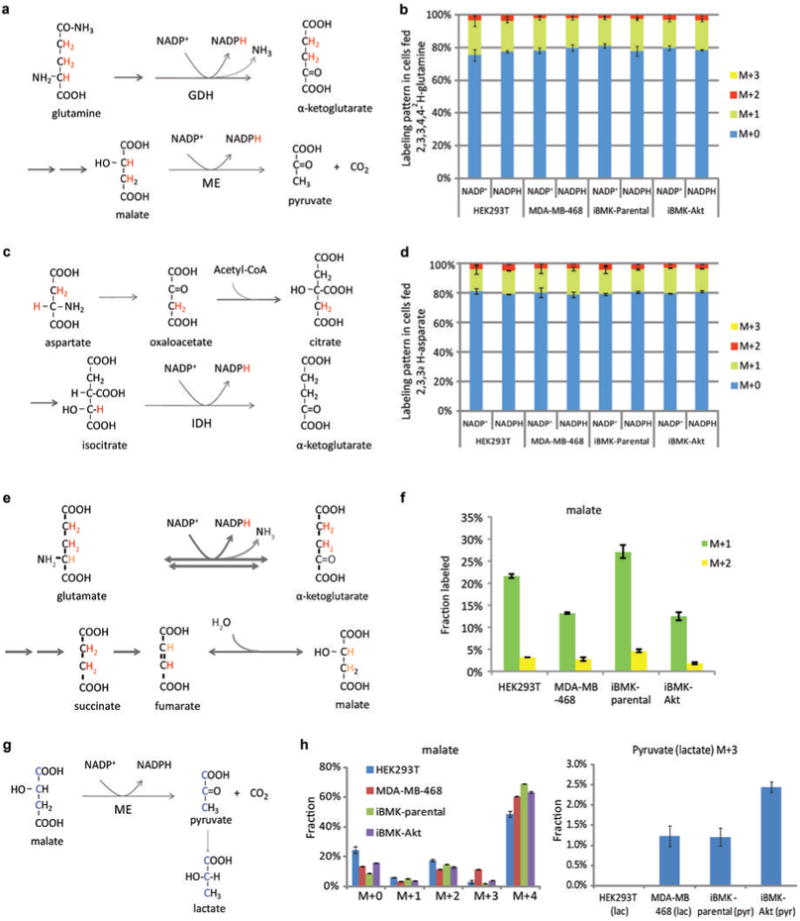
(a) Pathway diagram showing potential for 2,3,3,4,4-2H -glutamine to label NADPH via glutamate dehydrogenase and via malic enzyme. Labeled hydrogens are shown in red. (b) NADP+ and NADPH labeling patterns (without correction for natural 13C-abundance) after 48 h incubation with 2,3,3,4,4-2H-glutamine. The indistinguishable labeling of NADP+ and NADPH implies lack of NADPH redox active hydrogen labeling. (c) Pathway diagram showing potential for 2,3,3-2H-aspartate to label NADPH via isocitrate dehydrogenase. (d) NADP+ and NADPH labeling patterns (without correction for natural 13C-abundance) after 48 h incubation with 2,3,3-2H -aspartate. The indistinguishable labeling of NADP+ and NADPH implies lack of redox active hydrogen labeling. (e) Diagram of 2,3,3,4,4-2H-glutamine metabolism through TCA cycle, tracing labeled hydrogen. Hydrogen atoms of lighter shade indicate potential H/D exchange with water. (f) Malate labeling fraction after cells were fed 2,3,3,4,4-2H-glutamine for 48 h. (g) Pathway diagram showing potential for 1,2,3-13C-malate (made by feeding U-13C-glutamine) to label pyruvate and lactate via malic enzyme. (h) Extent of malate and pyruvate/lactate 13C-labeling. Cells were incubated with U-13C-glutamine for 48 h. M+3 pyruvate indicates malic enzyme flux, which may generate either NADH or NADPH. Similar results were obtained also for M+3 lactate, which was used as a surrogate for pyruvate in cases where lactate was better detected The corresponding maximal possible malic enzyme-driven NADPH production rate ranges, depending on the cell line, from < 2 nmol μL-1 h-1 to 6 nmol μL-1 h-1. Mean ± SD, N ≥ 2.