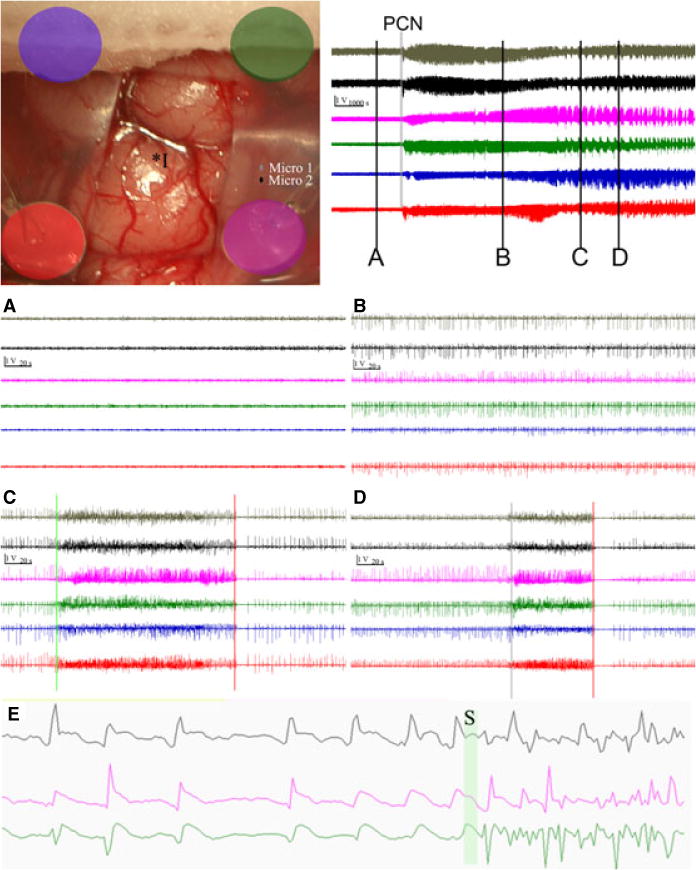
Figure 1.

upper left: Intraoperative picture of grid implantation and electrode setup. Color coded electrodes correspond to channels in attached EEG data. Position of PCN injection (I*) and microwire EEG channels (micro 1 and 2) are also shown. Upper right top: overall time course after injection (vertical bar is 1 volt, horizontal bar is 1000 seconds), bars with letter labels correspond to time for panels with appropriate letter below (vertical bar is 1 volt, horizontal is 20 seconds): grey bar labeled by PCN is the PCN injection. (A) grade 1 activity, EEG prior to injection of 5500 U of PCN (B) grade 2 activity, spiking seen for first 1–2 hours after PCN injection (C, D) examples of electrographic events (grade 3–4 activity) used to evaluate electrochemical data. Note the clear transition to synchronized activity greater than 3.5 Hz (green bars) and the most reliable time point for each event, the clear seizure stoppage with prolonged electrographic silence (red bars). (E) 10 seconds of EEG data from 1 microwire electrode (top) and two macrocontacts (bottom two) at increased magnification demonstrates the spike waveform. The green bar (S) represents a transition into an event.
