
Figure 2. Fixed potential amperometry (FPA) analysis of adenosine release during epileptiform events.
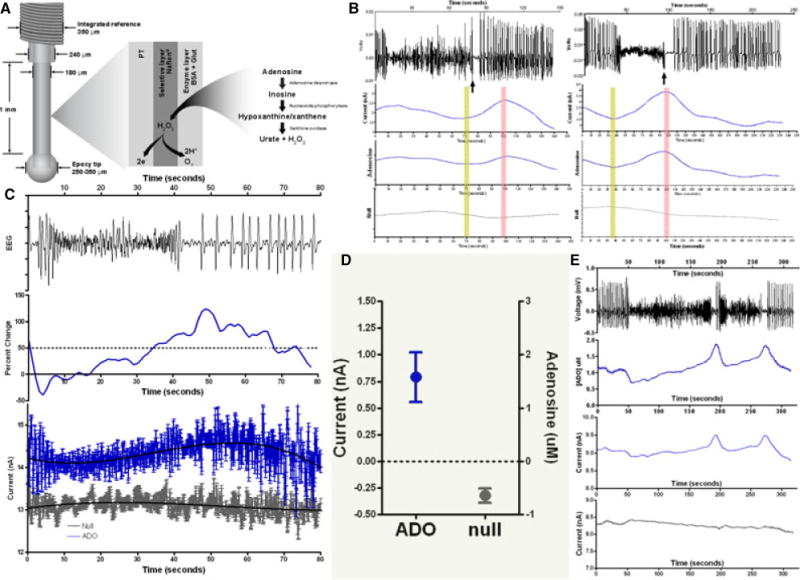
Amperometric (FPA) analysis of acute seizure model in swine: (A) schematic drawing of the dimensions and enzymatic setup of the biosensor used to detect adenosine; (B) two separate examples of seizures (EEG top) (note there is little variation in the raw null signal (bottom grey), but the raw (adenosine) and differential (adenosine-conrtrol (null)) signal demonstrate an increase in relative adenosine). The rising adenosine signal (yellow bar) and peak (pink bar) are noted; (C) averaged adenosine response for 5 seizures: top represents EEG signal, middle graph represents the normalized response of differential adenosine recordings (intervening pink bars represent mean + SEM (error bars) of the onset of adenosine increase and peak signal relative to seizure pause); bottom represents mean ± SD of the raw signal with blue the adenosine, grey control (null), and black lines the mean polynomial fit for this data; (D) 95% confidence interval for average peak values of adenosine (left y-axis nA, right is uM) and null. As expected there is a decrease in signal across time in the control (null) (grey), but also a marked increase in the adenosine concentration; (E) example of one event in which there were two pauses, each of which is associated with a unique adenosine increase.