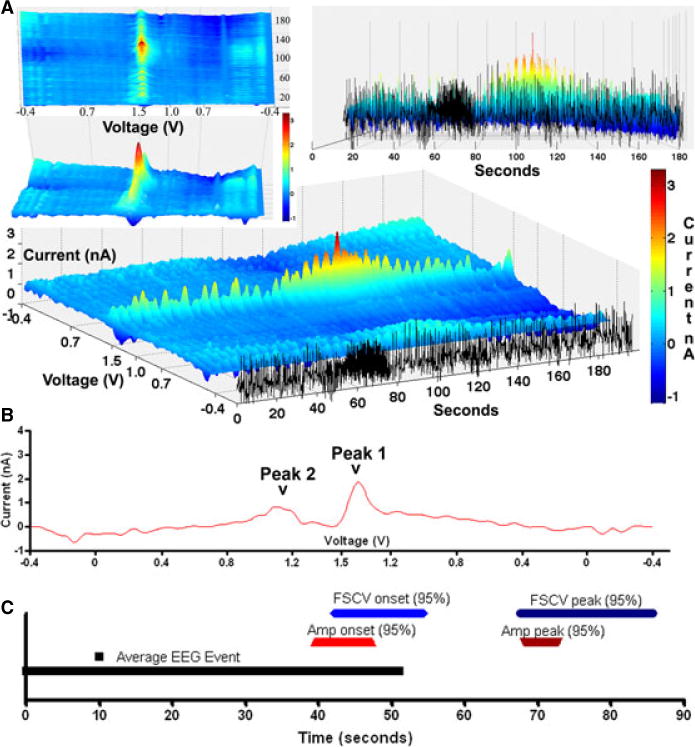
Figure 3. Fast scan cyclic voltammetry (FSCV) analysis of epileptiform events.

Time-locked FSCV and EEG: (A) Example of a epileptiform event evaluated by FSCV synchronized to EEG data with 3D mesh plots of the continuous data with the x axis representing seconds, the black tracing set apart, representing ne channel of EEG data, the y axis representing the voltage (V) of voltammogram scans starting at −0.4 to 1.5 (mid-y axis) to −0.4; and the z-axis representing the current (nA). Note after termination of the terminates, there is an elevation in the current at 1.5 V; (B) unfolded voltammogram demonstrating the unique Peak 1 (1.5V) and Peak 2 (1.0V) increases consistent with adenosine; (C) timeline showing average length of EEG event (black line), 95% CI of the onset and peaks of FSCV (blue) (n=15) and a comparative technique, amperometry (red) (n=75).
