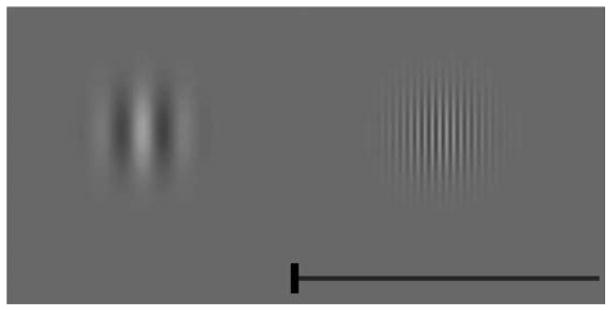
Figure 1.

Stimulus arrangement in the first part of Experiment 1. Target and Comparison Gabors were presented to the left and right of the display’s center. To adjust the Comparison Gabor’s spatial frequency to match that of the Target Gabor, a subject clicked on a horizontal adjustment bar located immediately below the Comparison stimulus. After each click, the spatial frequency of the Comparison Gabor changed, tracking changes in the location clicked. The short vertical bar changed position with each click, marking the clicked location (see text for details).
