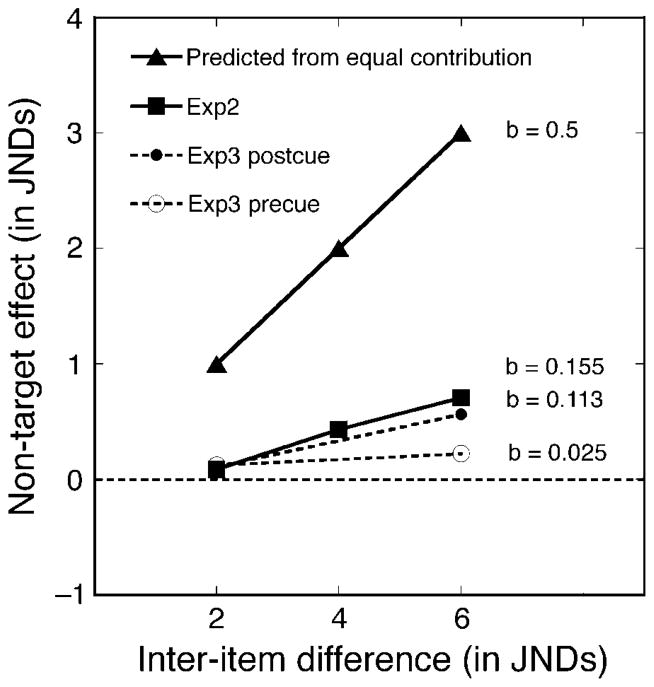
Figure 12.
Data points represent the Non-Target’s effect as a function of the inter-item difference in spatial frequency between Target and Non-Target stimuli. Data from trials when s1 was Target and those when s2 was Target are aggregated. Different lines show data in Experiment 2 (■) and Experiment 3’s post-cue (●) and pre-cue (○) conditions. The values of Non-Target’s effect predicted for a process in which the reproduction of the Target stimulus was determined by an equal-weighted visual averaging of s1 and s2’s spatial frequencies (▲) are also shown. The slope coefficient of each line, b, is shown as an index of the Non-Target’s weight in perceptual averaging. Note that b is the weight assigned to the Non-Target stimulus by the formula in Figure 11.

