
Figure 2.
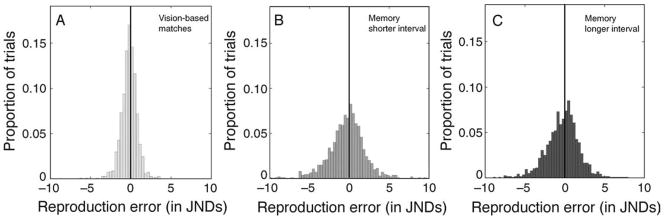
Frequency histograms showing transformed reproduction errors (TREs) from the three test conditions in Experiment 1. Data are aggregated over all eight subjects. (A) Distribution of transformed reproduction errors based on simultaneous matching of Target and Comparison Gabors. (B, C) Distributions of transformed reproduction errors produced when the Target Gabor’s spatial frequency was reproduced from memory. Results in (B) were taken with a post-stimulus retention interval of 1400 ms; results in (C) were taken with a post-stimulus retention interval of 2400 ms. In (A–C), black vertical lines indicate zero error.