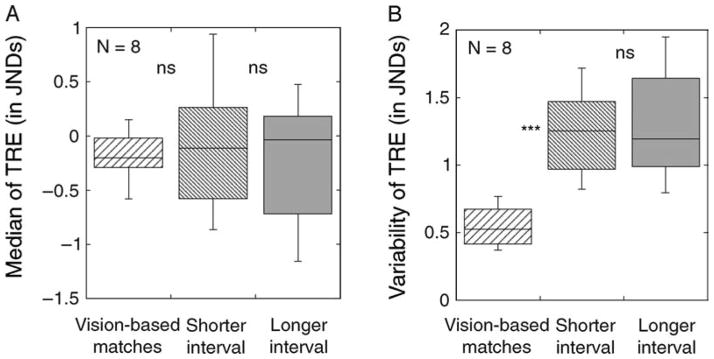
Figure 3.

(A) Boxplots showing the median transformed reproduction errors (TREs) in the three test conditions of Experiment 1. (B) Boxplots for the median absolute deviation (MAD) of transformed reproduction errors for the three conditions. A non-significant difference is shown as ns; a difference significant at p < 0.001 is shown as ***.
