
Figure 5.
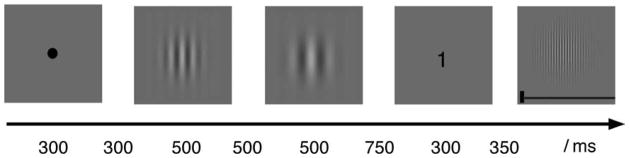
The timeline of events comprising one of Experiment 2’s trials. Subjects viewed two Gabors (s1 and s2) presented in rapid succession, followed by a cue, which was either the digit “1” or the digit “2”. In the example shown, the cue was “1”, meaning s1 was Target Gabor and was to be reproduced; s2 was Non-Target Gabor. Subjects reproduced the Target’s spatial frequency by adjusting the Comparison Gabor to match the remembered frequency of Target. See text for additional details.