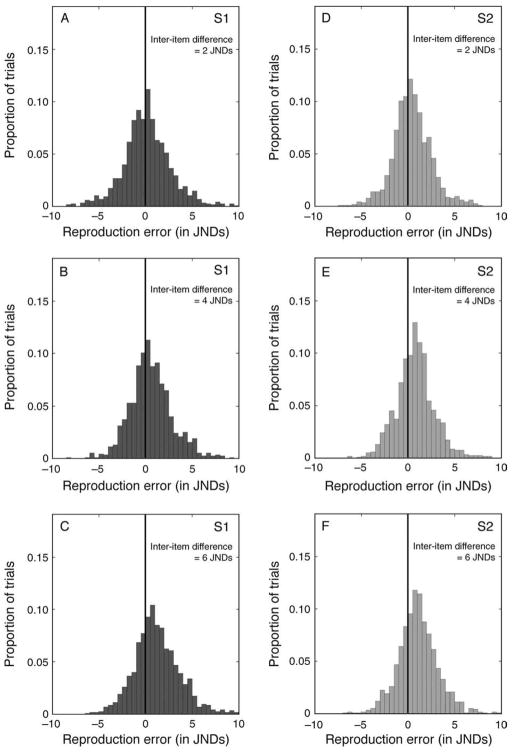
Figure 6.
Frequency histograms of reproduction errors made in various conditions in Experiment 2. In each histogram, the solid black vertical line marks the value of zero, that is, no error. (A–C) Histograms of errors made in reproducing s1, at inter-item differences of 2, 4, and 6 JNDs, respectively. (D–F) The errors for s2, with inter-item differences of 2, 4, and 6 JNDs, respectively.

