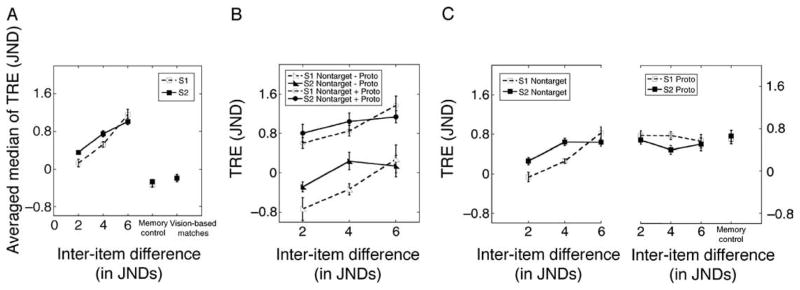
Figure 7.

(A) Averaged median reproduction errors for s1 and s2 as a function of inter-item difference. Data are for all eight subjects. The median reproduction errors from vision-based and memory-based (with a shorter interval or with a longer interval) performances in Experiment 1 are plotted as perceptual and memory controls. (B) Averaged median reproduction errors for s1 and s2 from two different sets of trials plotted separately as a function of inter-item difference. In one set of trials, the bias toward Non-Target and the bias toward the prototypical stimulus were in the same direction; in the second set, these two biases were toward different directions. (C) Left shows the average bias toward Non-Target for s1 and s2 as a function of inter-item difference. Right: the average bias toward the mean frequency of all preceding items within that block. The bias toward the mean frequency obtained in Experiment 1 when studying a single stimulus was plotted as memory control. Error bars are ±1 within-subject standard errors of the average value.
