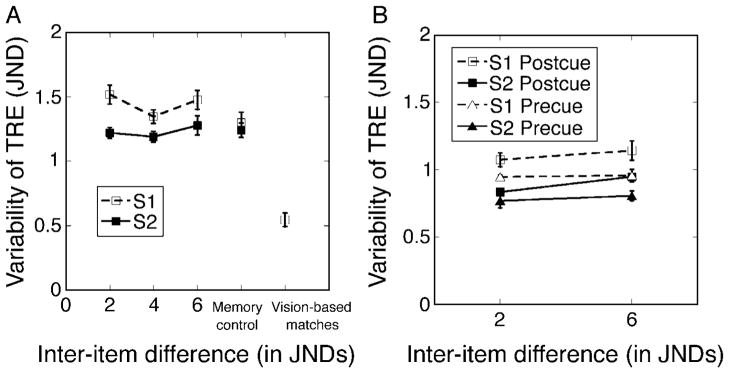
Figure 8.

(A) Mean variability of reproduction errors across subjects in Experiment 2. Separate curves are for s1 and s2, both as a function of inter-item difference. Results from Experiment 1’s memory and perceptual control conditions are also shown. Error bars are ±1 within-subject standard errors of the mean value. (B) Mean variability of reproduction errors for pre-cue and post-cue conditions in Experiment 3, separately for trials on which s1 was Target and trials on which s2 was Target.
