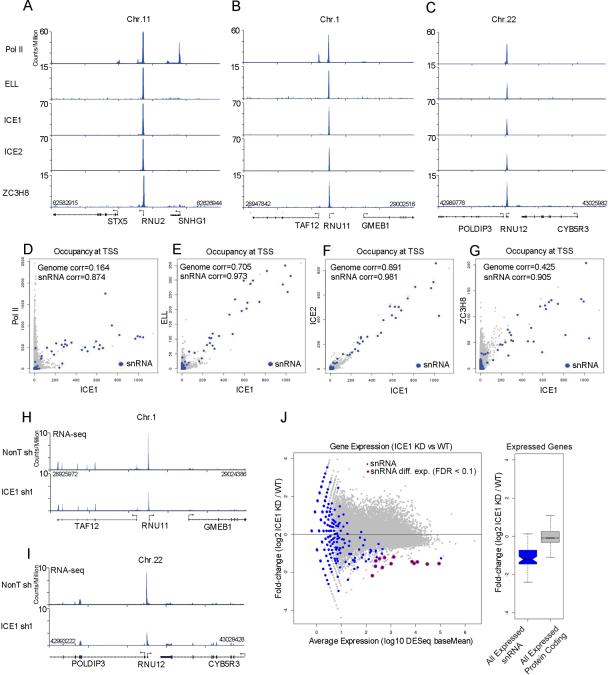
Figure 1. Functional conservation of the LEC complex in human cells.
(A-C) The human LEC complex is enriched at the promoters of the snRNA genes. Genome browser track examples for the occupancy of human LEC subunits ICE1, ICE2, ELL, and ZC3H8 as well as Pol II in HCT116 cells at the U2 (RNU2), U11 (RNU11), and U12 (RNU12) snRNA genes. Nearby protein-coding genes such as STX5, SNHG1 and TAF12 have high levels of Pol II, but no LEC. (D) Scatter plot depicting the genome-wide occupancy levels of Pol II vs. ICE1, showing that the highest co-bound genes are snRNA genes (blue color). Pearson correlations are shown. (E-G) Scatter plots depicting the genome-wide occupancy levels of ELL (E), ICE2 (F), and ZC3H8 (G) versus ICE1. Occupancy levels were measured as the sum of reads per million (RPM) aligned within 10 bp of all ENSEMBL 69-annotated transcription start sites. (H-J) RNA-seq analysis shows that ICE1 regulates snRNA gene expression. (H-I) Genome browser tracks show examples of RNA-seq data surrounding the RNU11 and RNU12 genes. The expression of RNU11 and RNU12, but not nearby protein-coding genes, is decreased in ICE1 shRNA-treated samples. (J) The left panel shows a MA plot of the genome-wide expression changes as determined by RNA-seq for ICE1 shRNA. The x-axis shows the log10 normalized read abundance (baseMean) of knockdown and non-targeting samples as reported by DESeq (Anders and Huber, 2010). The y-axis shows the log2 fold changes of normalized read abundance of ICE1 knockdown (KD) divided by the wild-type (WT) condition. Annotated snRNA genes are shown in blue. Differentially expressed snRNA genes (FDR<0.1) as reported by DESeq are circled in red. The right panel shows a boxplot of the log2 fold change ICE1 KD divided by WT for expressed snRNA genes (blue box) and all expressed protein coding genes (gray box). A baseMean of 10 was chosen as the cutoff for determining whether a gene is expressed. Box plot colored portions indicate the middle quartiles; the whiskers indicate a maximum of 1.5 of the interquartile range; middle notches indicate a 95% confidence interval of the median. See Figure S1 for related information.

