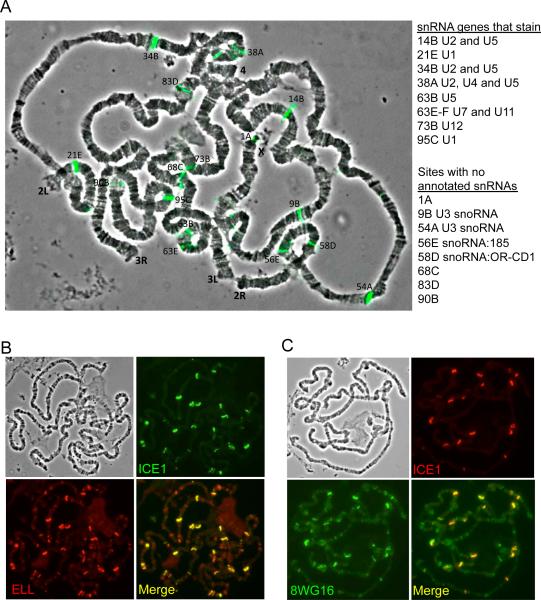
Figure 3. Overexpression of ICE1 in larval salivary glands re-localizes ELL and Pol II on polytene chromosomes.
(A) Overlay of ICE1 (green) immunostaining and the phase contrast image in ICE1 overexpressing salivary glands. Many of the sites of ICE1 staining correspond to snRNA genes as annotated in Flybase (right panel). A few of the mapped sites correspond to genes annotated as snoRNAs. These particular snoRNAs are LEC targets, as they were previously reported to have high levels of LEC in S2 cells and their levels are reduced after RNAi of ICE1 and ELL in S2 cells (Smith et al., 2011). (B) In ICE1 overexpressing glands, some of the strongest sites of ELL co-localize with the ectopically expressed ICE1. (C) ICE1 overexpression leads to strong occupancy of Pol II at the ectopic sites of ICE1 when visualized with the 8WG16 monoclonal recognizing unmodified Pol II. Phase contrast images for B-C are shown in the upper left panels. See Figure S3 for related information.

