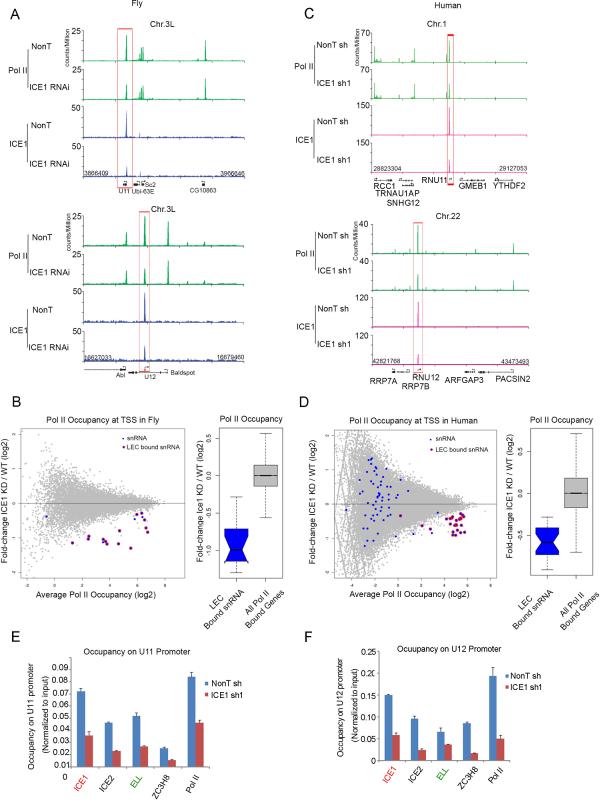
Figure 4. ICE1 specifically regulates the occupancy of Pol II and LEC subunits at the snRNA genes.
(A) Genome browser track examples of Pol II occupancy in non-targeting (Non T) and ICE1-depleted Drosophila S2 cells. Pol II occupancy is specifically down-regulated at U11 and U12 snRNA genes, but does not change at their neighboring protein-coding genes, such as Baldspot, Sc2, and Abl. (B) The left panel shows a MA plot of the genome-wide Pol II occupancy after ICE1 depletion in Drosophila S2 cells. The x-axis shows the log2 geometric average of Pol II occupancy as measured as the maximum read sums per million sequenced (RPM) within the TSS and 100 bp downstream of the TSS for all annotated transcription start sites. Only Pol II-bound transcripts are shown that had enriched Pol II regions (MACS p < 0.05) in the wild-type sample within 100 bp of an annotated start site. The y-axis shows the log2 fold change of the Pol II occupancy levels measured by taking the occupancy levels in the knockdown divided by the non-targeting control. Pol II-bound snRNA genes are shown in blue. Some transcriptionally silent snRNA genes are called bound by Pol II using our peak finding criteria due to their proximity to other transcribed genes, so we defined a high confidence LEC target set for start sites that showed a two-fold or greater loss of ICE1 occupancy with 10 bp of the transcription start site in the ICE1 RNAi condition compared to wild-type ICE1 ChIP-seq levels. These genes are highlighted with a red circle. The right panel is a box plot analysis of the log2 fold change in Pol II occupancy after ICE1 RNAi. (C) Genome browser track examples of Pol II occupancy in non-targeting and ICE1-depleted human HCT116 cells. Pol II occupancy is specifically reduced at RNU11 and RNU12 snRNA genes, but does not change at their neighboring protein-coding genes. (D) The left panel shows a MA plot of the genome-wide Pol II occupancy after ICE1 depletion in HCT116 cells, as plotted in Panel B. LEC-bound snRNAs are highlighted with red circles. The snRNA genes with LEC bound in the wild-type condition show a general loss of Pol II after RNAi. The right panel is a box plot representation of the log2 fold change in Pol II after ICE1 knockdown. (E-F) ICE1 is required for recruitment of LEC subunits ICE2, ELL, and ZC3H8 to the RNU11 and RNU12 snRNA genes. ChIP-qPCR was performed with ICE1, ICE2, ELL, ZC3H8, ELL, and Pol II antibodies in control and ICE1-depleted HCT116 cells. Error bars represent the standard deviations. See Figure S4 for related information.

