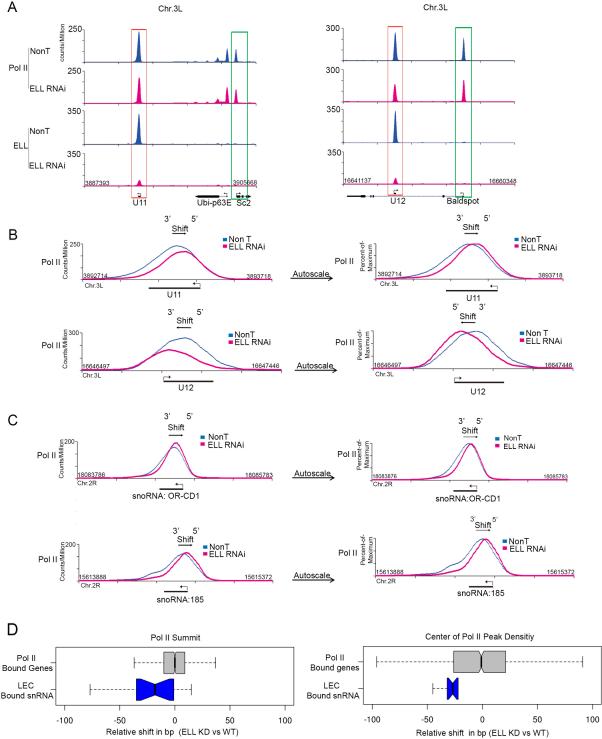
Figure 5. ELL knockdown affects the Pol II distribution across snRNA genes.
(A) Genome browser track examples of Pol II occupancy at snRNA and neighboring genes in non-targeting (Non T) and ELL-depleted Drosophila S2 cells. Pol II occupancy at snRNA genes is less affected after ELL knockdown compared to ICE1 depletion (compare to Figure 5A and Figures 4A and S4A), even though ELL itself is greatly reduced at the snRNA genes. (B) Overlay and expanded view of the NonT and ELL knockdown Pol II occupancies at U11 (top panels) and U12 (bottom panels). The peak Pol II signal in the ELL knockdown is shifted in the direction of the transcription start site (TSS) for each gene. Left panels compare the Pol II signals in NonT and knockdown using the same fixed scales. The right panels are scaled to the maximum peak signal of each condition to allow better visualization of the shift in the overall distribution of Pol II after ELL knockdown. (C) Track examples showing a shift in Pol II towards the TSS of two snoRNA genes that are regulated by LEC (Smith et al., 2011). Fixed and percent-of-maximum versions are plotted as in (B). (D) Quantitation of the degree of shift as seen by two distinct measurements. The left panel shows a box plot representation of the distance, in base pairs, from the Pol II peak summit in the wild-type condition to the Pol II peak summit in the ELL RNAi knockdown. The box plot in the right panel instead uses the distance from the center of read density of the Pol II enriched region at each gene. All genes are oriented 5’ to 3’ such that negative values indicate a shift toward the 5’ end of the gene. The set of LEC-bound snRNAs and all Pol II-bound genes are the same as in Figure 4B. See Supplemental Figure S5 for related information.

