
Figure 1. Phosphoproteomics workflow.
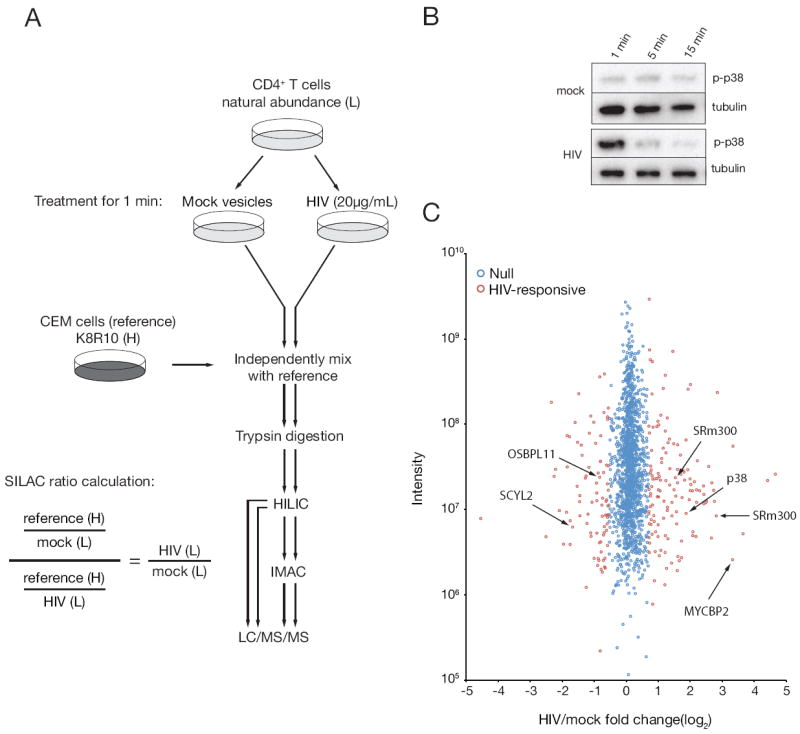
(A) Phosphoproteomics workflow for T cell stimulations, processing, and fractionation. Virus and mock-treated samples were independently processed following mixing with a common reference lysate. HIV/mock phosphorylation site fold-changes were calculated by dividing the ratio of reference/mock by reference/HIV phosphorylation site fold-changes. Abbreviations: light (L), heavy (H), hydrophilicity interaction liquid chromatography (HILIC), immobilized metal affinity chromatography (IMAC), liquid chromatography tandem mass spectrometer (LC/MS/MS). (B) Primary CD4+T cells were incubated with purified HIV-1 or a mock vesicle preparation for various lengths of time at 37°C and probed for phosphorylated p38 (pT180/pY182) by immunoblot to determine optimal kinetics for large scale phosphoproteomics stimulations. (C) Distribution of phosphorylation site fold-changes. HIV/mock phosphorylation site fold-changes are shown according to the mixture model designation of HIV-responsive (red) or HIV-nonresponsive, i.e. null (blue). For clarity, only a subset of SRm300-responsive phosphorylation sites is indicated. See also Figure S1.