Figure 7.
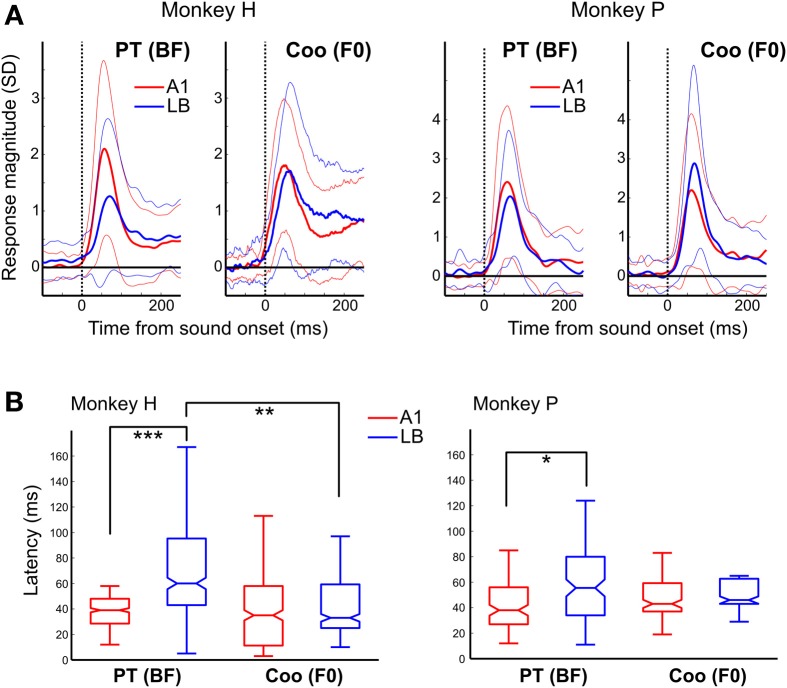
Average response to the pure-tone BF and to coo calls with F0 matched to the BF. (A) PSTH of the responses in A1 (red) and LB (blue) averaged separately across all auditory neurons to their BF (left panel) and to a coo (right panel) whose F0 was matched to the BF. The similarly color-coded thin lines show the standard deviations from the average response. The dotted vertical line indicates sound onset. Latencies to the BF in LB were longer than those to a coo (median ± SE, monkey H: median: 39 vs. 60 ms, Q1: 29 vs. 43 ms, Q3: 48 vs. 95 ms, p < 0.001; monkey P: median: 38 vs. 56 ms, Q1: 27 vs. 34 ms, Q3: 56 vs. 80 ms, p < 0.05). By contrast, there were no latency differences between A1 and LB in response to a coo (monkey H: median: 35 vs. 33 ms, Q1: 11 vs. 25 ms, Q3: 58 vs. 59 ms, p = 0.55; monkey P: median: 43 vs. 46 ms, Q1: 37 vs. 43 ms, Q3: 59 vs. 63 ms, p = 0.38). (B) Neural latencies to the BF in response to pure tones (PT) and to the coo with its F0 matched to the neuron's BF. Unlike the latencies observed in response to PTs and PNBs (Figure 3), there was no difference between A1 and LB latency in response to coo. Furthermore, the latency to coo was significantly shorter than the latency to the BF in LB at the population level (two animals: 43 ms vs. 59 ms, p < 0.01). The abbreviations used for the box and whisker plots are the same as in Figure 3. *p < 0.05, **p < 0.01, ***p < 0.001.

