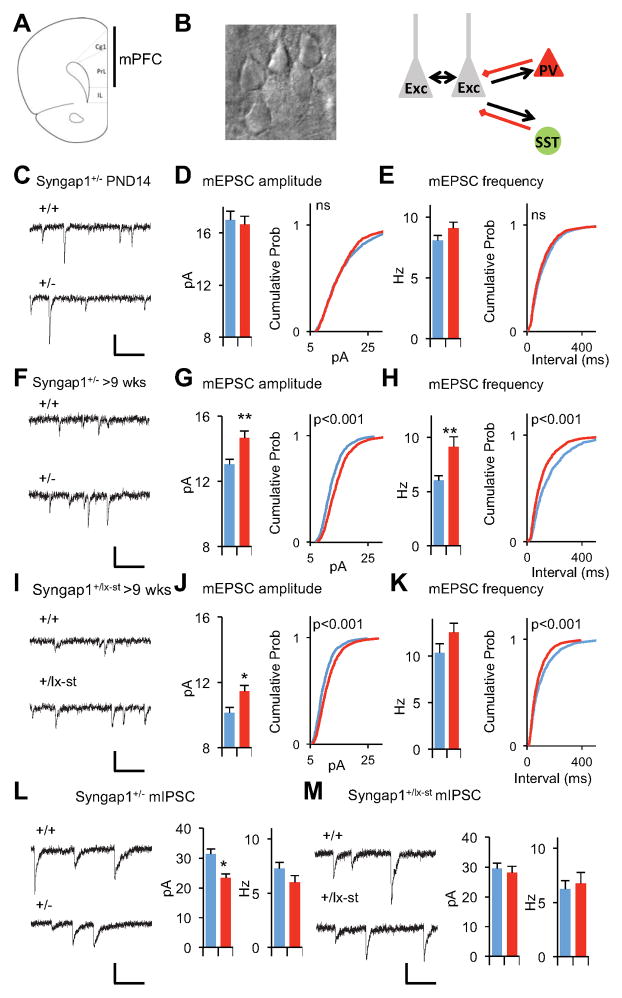
Figure 2. The gradual development of E/I imbalance in layer 2/3 pyramidal neurons in Syngap1+/− mice.
(A) A coronal section through the mouse brain illustrating where in the mPFC targeted whole-cell recordings were performed. Cg1: cingulated cortex area 1; PL: prelimbic cortex; IL: infralimbic cortex.
(B) A high magnification DIC image of example layer 2/3 neurons and simplified diagram of layer 2/3 circuitry
(C) Example recordings of mEPSC events in PND14 Syngap1+/− animals. Scale bar, 20 pA, 100ms.
(D) Bar graph and cumulative percentage plots show normal mEPSC amplitude in PND14 Syngap1+/− animals (n=15 neurons +/+, n=14 neurons +/−; t(27)=0.40, p=0.69. Two sample K-S test on cumulative percentage distribution Z=1.17, p=0.13)
(E) Bar graph and cumulative percentage plots show normal mEPSC frequency in PND14 Syngap1+/− animals (n=15 neurons +/+, n=14 neurons +/−; t(27)=1.52, p=0.14 Two sample K-S test on cumulative percentage distribution Z=1.14, p=0.15.)
(F) Example recordings of mEPSC events in >9 wks old Syngap1+/− animals. Scale bar, 20 pA, 100ms.
(G) Bar graph and cumulative percentage plots show increased mEPSC amplitude in >9 wks old Syngap1+/− animals (n=12 neurons +/+, n=11 neurons +/−; t(21)=3.61, p=0.0016. Two sample K-S test on cumulative percentage distribution Z=4.34, p<0.001)
(H) Bar graph and cumulative percentage plots show increased mEPSC frequency in >9 wks old Syngap1+/− animals (n=12 neurons +/+, n=11 neurons +/−; t(21)=3.02, p=0.0065. Two sample K-S test on cumulative percentage distribution Z=3.99, p<0.001
(I) Example recordings of mEPSC events in >9 wks old Syngap1+/lx-st animals. Scale bar, 20 pA, 100ms.
(J) Bar graph and cumulative percentage plots show increased mEPSC amplitude in >9 wks old +/lx-st animals (n=9 neurons +/+, n=14 neurons +/−; t(21)=2.57, p=0.018. Two sample K-S test on cumulative percentage distribution Z= 5.42, p<0.001)
(K) Bar graph and cumulative percentage plots show slightly increased mEPSC frequency in >9 wks old +/lx-st animals (n=9 neurons +/+, n=14 neurons +/−; t(21)=1.50, p=0.15. Two sample K-S test on cumulative percentage distribution Z= 3.53, p<0.001)
(L) Bar graphs and example recordings show reduced mIPSC amplitude and normal mIPSC frequency in in >9 wks old Syngap1+/− animals. (n=12 neurons +/+, n=12 neurons +/−; t(22)=2.57, p=0.02 for mIPSC amplitude; t(22)=0.88, p=0.39 for mIPSC frequency). Scale bar, 30 pA, 100ms.
(M) Bar graphs and example recordings show normal mIPSC amplitude and normal mIPSC frequency in >9 wks old Syngap1+/lx-st animals. (n=9 neurons +/+, n=7 neurons +/−; t(14)=0.48, p=0.64 for mIPSC amplitude; t(15)=0.40, p=0.70 for mIPSC frequency). Scale bar, 20 pA, 100ms.
Wild-type(+/+), blue; mutants(+/−), red for all bar graphs. Error bars denote +SEM. *p<0.05, **p<0.01.

