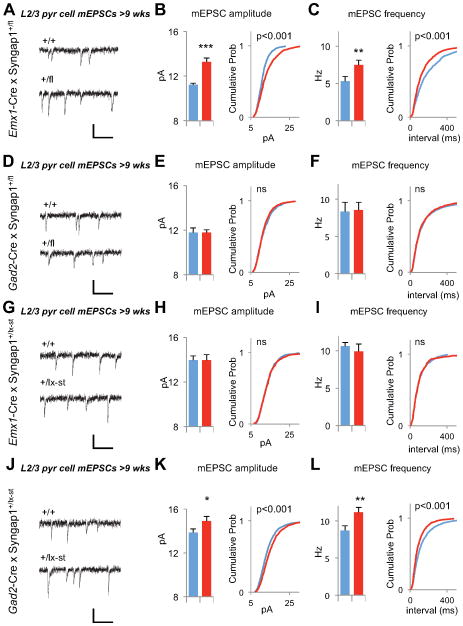
Figure 6. Enhanced Layer 2/3 excitatory synaptic function is an indicator of reduced cognition in Syngap1 mutants.
(A) Example recordings of mEPSC events from +/+ and +/fl mice obtained by Emx1-Cre x Syngap1+/fl cross. Scale bar, 20 pA, 100ms.
(B) Bar graph and cumulative percentage plots show increased mEPSC amplitude in Emx1-Cre;+/fl mice (n=10 +/+, n=12 +/fl, t(20)=4.92, p=8.2×10⁻⁵. Two sample KS test on cumulative percentage distribution Z=4.24, p<0.001)
(C) Bar graph and cumulative percentage plots show increased mEPSC frequency in Emx1-Cre;+/fl mice (n=10 +/+, n=12 +/fl, t(20)=2.26, p=0.035. Two sample K-S test on cumulative percentage distribution Z=3.39, p<0.001)
(D) Example recordings of mEPSC events from +/+ and +/fl mice obtained by Gad2-Cre x Syngap1+/fl cross. Scale bar, 20 pA, 100ms.
(E) Bar graph and cumulative percentage plots show normal mEPSC amplitude in Gad2-Cre;+/fl mice (n=11 +/+, n=11 +/fl, t(20)=0.03, p=0.98. Two sample K-S test on cumulative percentage distribution Z=1.12, p=0.16)
(F) Bar graph and cumulative percentage plots show normal mEPSC frequency in in Gad2-Cre;+/fl mice (n=11 +/+, n=11 +/fl, t(20)=0.14, p=0.89. Two sample K-S test on cumulative percentage distribution Z=0.69, p=0.73)
(G) Example recordings of mEPSC events from +/+ and +/lx-st mice obtained by Emx1-Cre x Syngap1+/lx-st cross. Scale bar, 20 pA, 100ms.
(H) Bar graph and cumulative percentage plots show normal mEPSC amplitude in Emx1-Cre;+/lx-st mice (n=17 +/+, n=13 +/lx-st, t(28)=0.00045, p=0.99. Two sample K-S test on cumulative percentage distribution Z=0.62, p=0.83)
(I) Bar graph and cumulative percentage plots show normal mEPSC frequency in in Emx1-Cre;+/lx-st mice (n=17 +/+, n=13 +/lx-st, t(28)=0.68, p=0.50. Two sample K-S test on cumulative percentage distribution Z=0.50, p=0.96)
(J) Example recordings of mEPSC events from +/+ and +/lx-st mice obtained by Gad2-Cre x Syngap1+/lx-st cross. Scale bar, 20 pA, 100ms.
(K) Bar graph and cumulative percentage plots show increased mEPSC amplitude in Gad2-Cre;+/lx-st mice (n=19 +/+, n=19 +/lx-st, t(36)=2.49, p=0.017. Two sample K-S test on cumulative percentage distribution Z=3.86, p<0.001)
(L) Bar graph and cumulative percentage plots show increased mEPSC frequency in Gad2-Cre;+/lx-st mice (n=19 +/+, n=19 +/lx-st, t(36)=3.15, p=0.0033. Two sample K-S test on cumulative percentage distribution Z=4.34, p<0.001)
Wild-type, blue; mutants, red for all bar graphs. Error bars denote +SEM. *p<0.05, **p<0.01, ***p<0.001.

