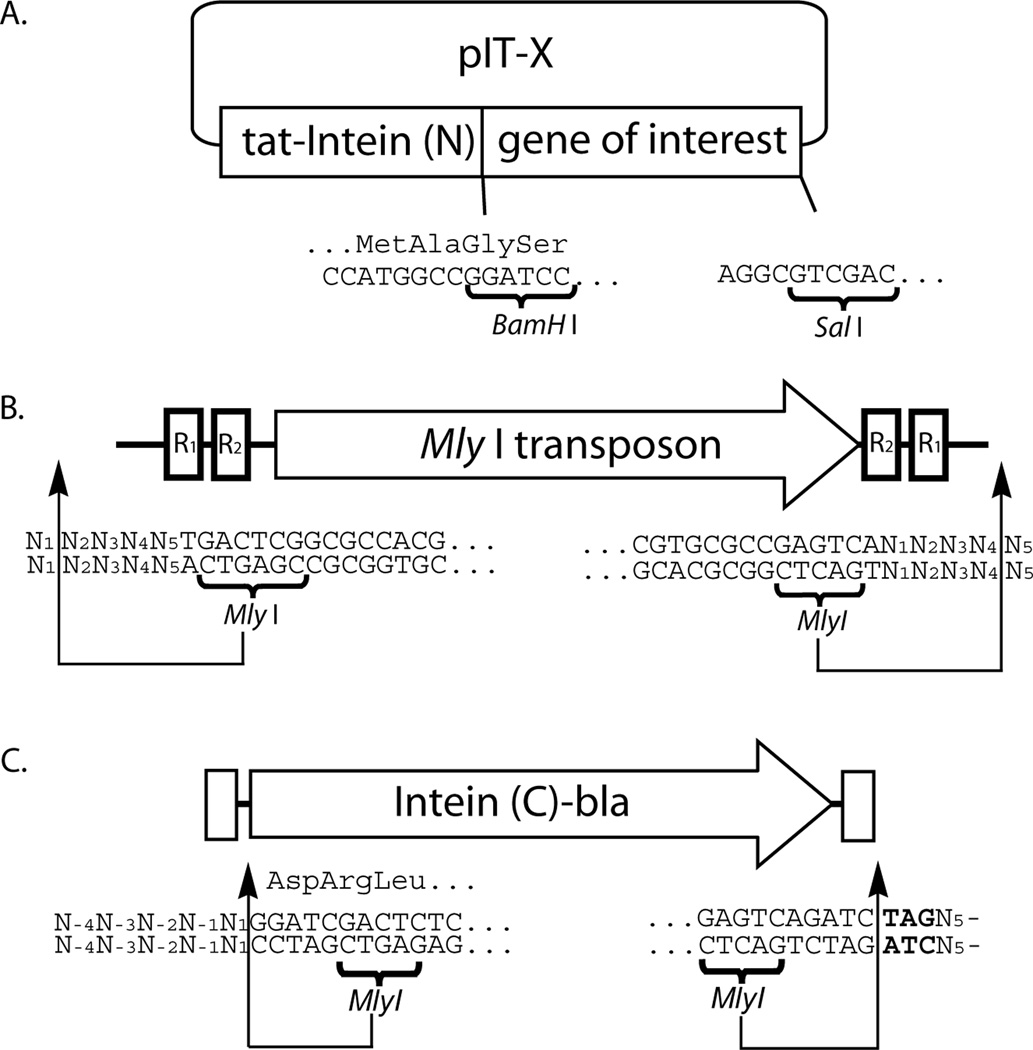
Figure 1.
Schematic diagram showing the DNA components described in this protocol with nucleotides numbered relative to original transposon insertion site. A) The cloning site of pIT-X indicating correct reading frame. Oligonucleotides used for protein of interest must match the correct reading frame. B) Mly I transposon showing positioning of restriction sites as it would insert into a segment of DNA. C) Reading-frame selectable linker showing restriction sites, frame, and amber stop codon scar in bold.

