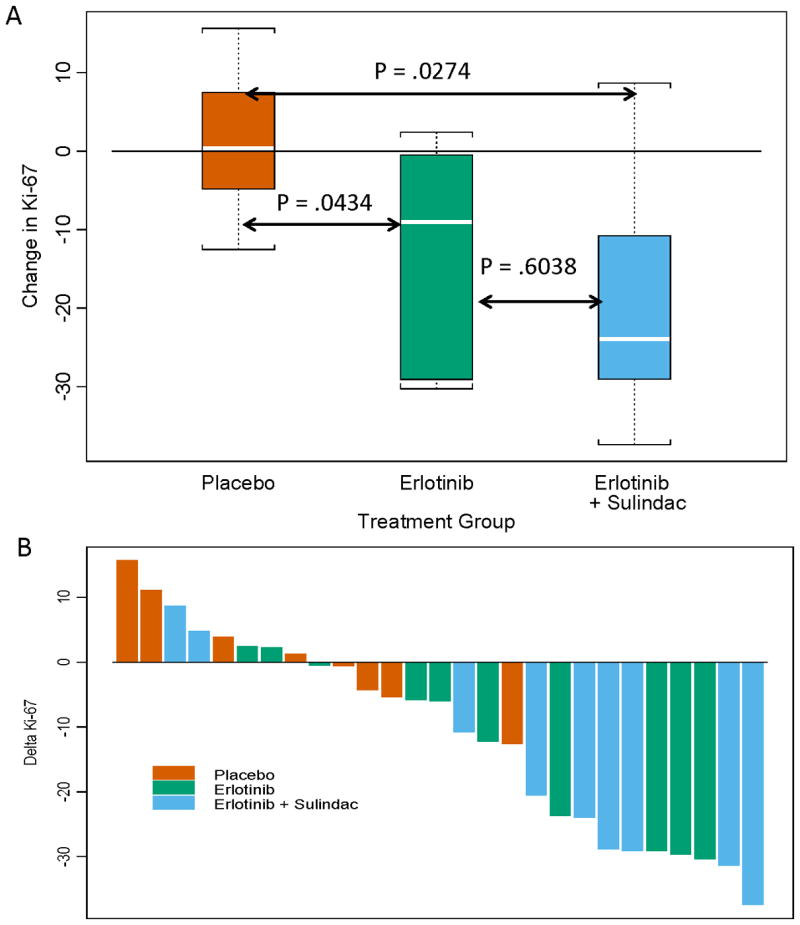
Figure 2.

The Primary Endpoint, Ki-67 Proliferation Index. (A) The primary omnibus hypothesis demonstrated a significant difference in Ki-67 modulation among groups (two-sided Kruskal-Wallis, p=0.04). Depicted in this box and whisker plot are the Wilcoxon pairwise contrasts confirming a significant decrease in Ki-67 for patients treated with either erlotinib or erlotinib-sulindac vs. placebo. Box and whisker plots consist of the median (white line), the inter-quartile range (box) and the distance to observed values within 1.5 times the inter-quartile range (whiskers). (B) A waterfall plot depicts the intra- patient change in tumoral Ki-67 expression, pre and post-treatment. Bars are color-coded according to treatment arm.
