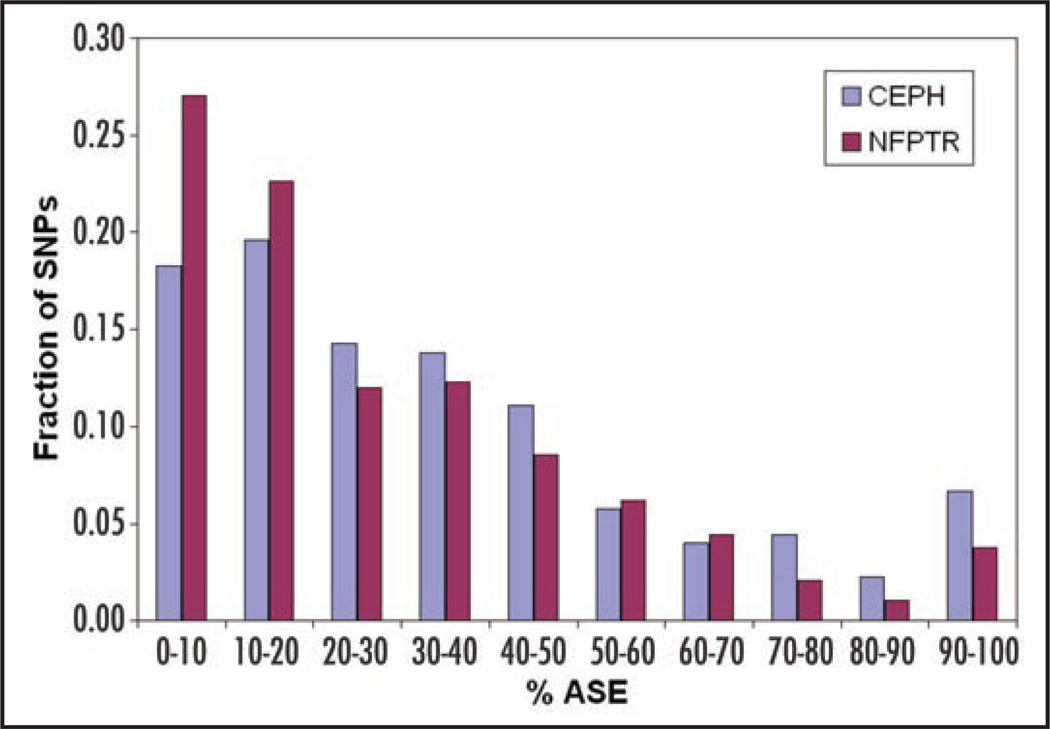
Figure 3.
Global ASE distribution in control and pancreatic cancer samples. A genomic ASE genome index may be estimated as the fraction of heterozygotes displaying ASE (Y-axis represents the percentage of SNPs normalized within control and pancreatic cancer samples). The global distribution of this genomic index is not statistically significant (p < 0.15) between CEPH and NFPTR samples, although there is a trend towards lower ASE levels in the pancreatic cancer germline.

