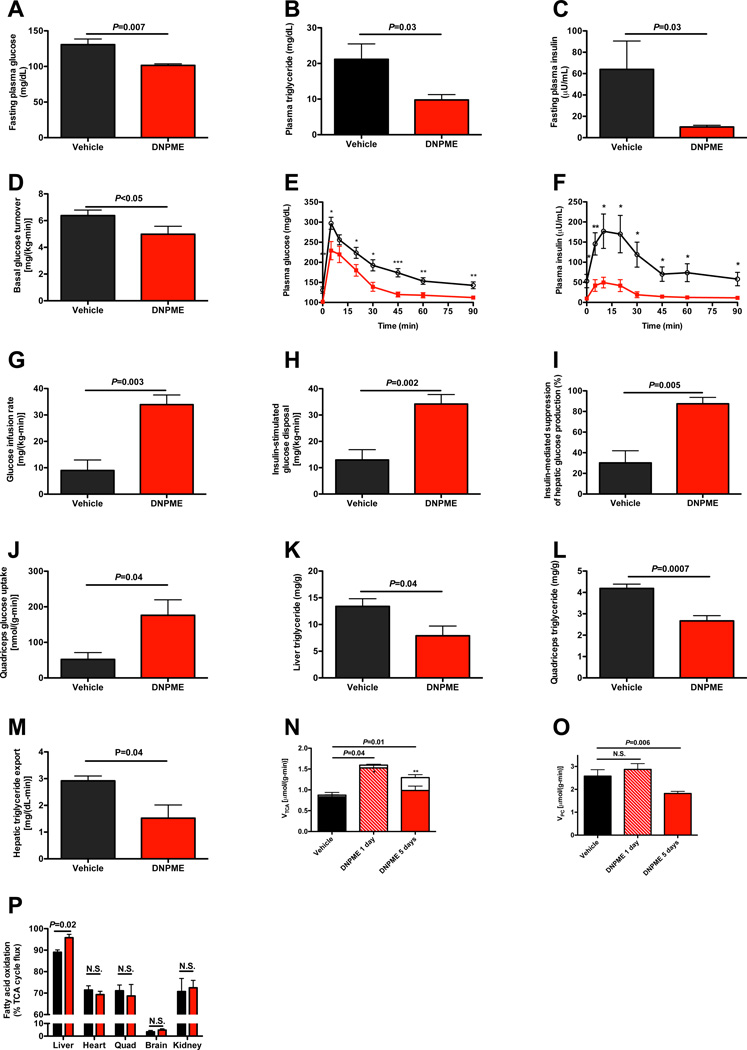
Fig. 2.
DNPME reverses NAFLD, hypertriglyceridemia as well as liver and muscle insulin resistance in rats previously fed high fat diet and sucrose water for 2 weeks, then treated with 5 mg/kg DNPME per day daily for 5 days. (A)–(C) Fasting plasma glucose, triglyceride, and insulin. (D) Basal glucose turnover. (E), (F) Plasma glucose and insulin during an intraperitoneal glucose tolerance test. Black circles = vehicle treated, red squares = DNPME treated. *P<0.05, **P<0.01, ***P<0.001. (G) Glucose infusion rate to maintain euglycemia during the hyperinsulinemic-euglycemic clamp. (H) Insulin-stimulated glucose metabolism. (I) Insulin-mediated suppression of hepatic glucose production. (J) Insulin-stimulated glucose uptake in quadriceps. (K), (L) Liver and quadriceps TAG. (M) Liver VLDL production. (N) Liver TCA cycle flux (sum of red and white bars) and substrate contributions (fatty acid oxidation, solid bar; flux through PDH, white bar) to the TCA cycle. In panels (N) and (O), n=3 vehicle treated, 3 1 day DNPME treated, and 6 5 days DNPME treated. (O) Fatty acid oxidation relative to VTCA in 1 day DNPME or vehicle treated rats (n=3). (P) Hepatic flux through pyruvate carboxylase. Rats were fasted overnight (16 hours) prior to each of these studies. Unless otherwise specified, n=5–8 per group. Data are represented as mean ± S.E.M. See also Fig. S2.

