Fig. 4.
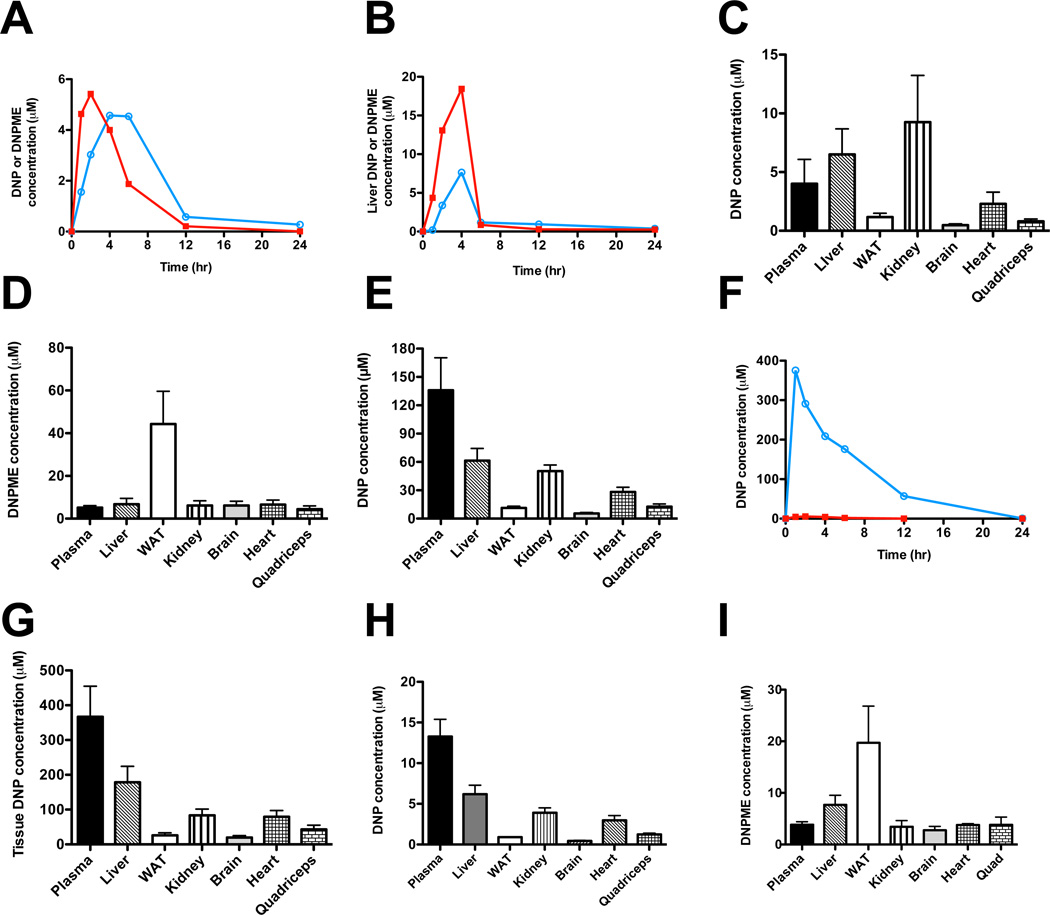
Plasma and tissue kinetics of DNP and DNPME metabolism in chow-fed Sprague-Dawley rats. (A) Plasma DNP and DNPME concentration after an intraperitoneal injection of DNPME (5 mg/kg) at time zero. (B) Liver DNP and DNPME concentration after an injection of DNPME (5 mg/kg). In panels A and B, red squares = DNPME, blue circles = DNP; each timepoint represents an individual animal. (C), (D) Tissue concentrations of DNP and DNPME 4 hours after an injection of DNPME (5 mg/kg). (E) Tissue concentration of DNP 1 hour after an injection of DNP (5 mg/kg). (F) Plasma DNP concentration after an injection of DNP (25 mg/kg, blue circles) or DNPME (5 mg/kg, red squares). Each timepoint represents an individual animal. (G) Plasma and tissue concentrations of DNP after injection of DNP (25 mg/kg). Tissues were isolated 1 hour after DNP injection. (H), (I) DNP and DNPME concentrations in tissues after 7 days of daily DNPME injections (5 mg/kg per day). Unless otherwise noted, n=4 per group. Data are expressed as mean ± S.E.M. See also Fig. S4.

