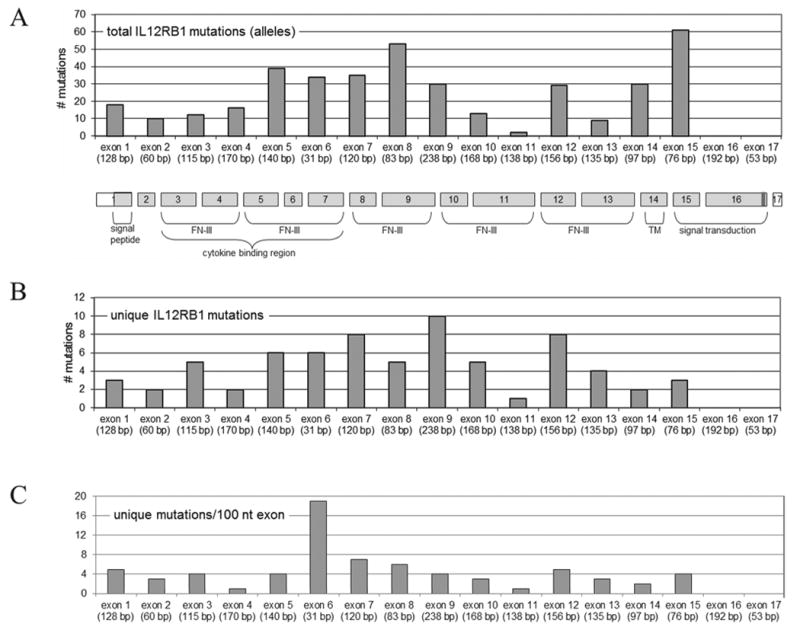
Figure 2.

Genomic structure, encoded protein domains and mutation distribution in the IL12RB1 gene. Numbers and positions of total (A) and unique (B) variants are shown, as well as mutation distribution ratio as determined by dividing the number of unique mutations per exon by the exon length (C). FN III = Fibronectin type III repeat regions, TM = transmembrane domain. The coding region of the transcript is indicated in light grey. The last 13 bp of exon 16 (indicated in dark grey) are subject to alternative splicing (50:50 distribution). Note: mutations in splice sites and genomic deletions grouped under (first) affected exon.
