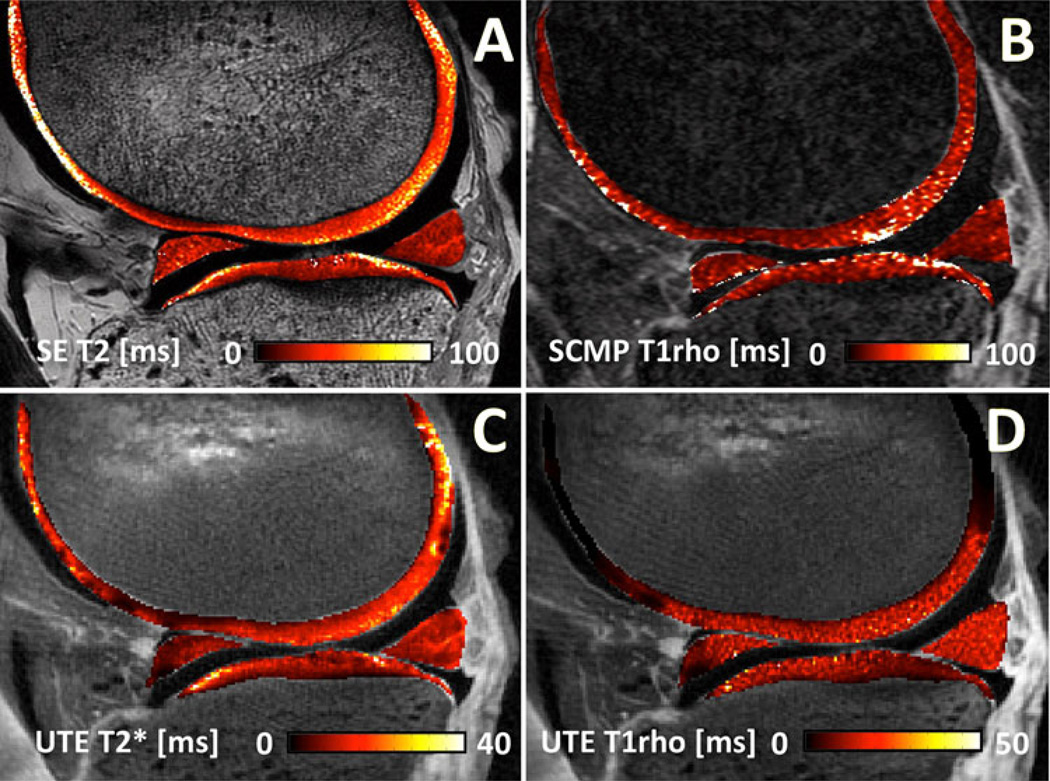
Fig. 3.
Quantitative MRI of the knee. Conventional a spin echo multi-echo T2 map (SE; TR = 2,000 ms, TE = 10–80 ms, 8 TEs) and b spiral chopped magnetization preparation (SCMP; TR = 1,500 ms, TE = 3 ms, TSL = 10–40 ms, 4 TSLs) show relatively high T2 and T1rho values of articular cartilage. In comparison, quantitative c UTE T2* (TR = 100 ms, TE = 0.012–60 ms, 16 TEs) and d UTE T1rho (TR = 100 ms, TE = 0.012, TSL = 0.02–10 ms, 4 TSLs) are able to detect short T2 components in articular cartilage and other soft tissues

