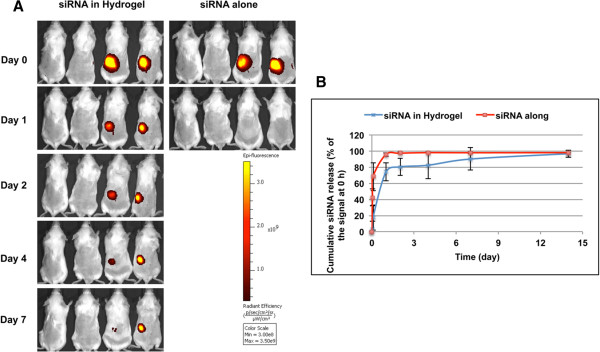
Figure 6.

Release profile of Cy5 labeled siRNA complexed within hydrogel in mice. Mice were injected s.c. with chitosan hydrogel/Cy5-siRNA, Cy5-siRNA alone and PBS buffer (n = 4). Fluorescent optical imaging was performed at the indicated time points after injection. (A), Images from 2 mice 0, 1, 2, 4 and 7 days after injection with chitosan hydrogen/Cy5-siRNA and images from 2 mice 0 and 1 day after injection with Cy5-siRNA alone. Two mice injected with buffer (Two mice on the left in each panel) were included as control for both scanning. (B), After quantifying the signal intensity of images, siRNA release was calculated as reduction of fluorescent signal: (RE (0 h) – RE (Designed Time Point)) /RE (0 h) * 100%. Average value from each time point (0, 1, 2 h, and 1, 2, 4, 7, 14 d) was presented (mean ± SD, n = 4).
