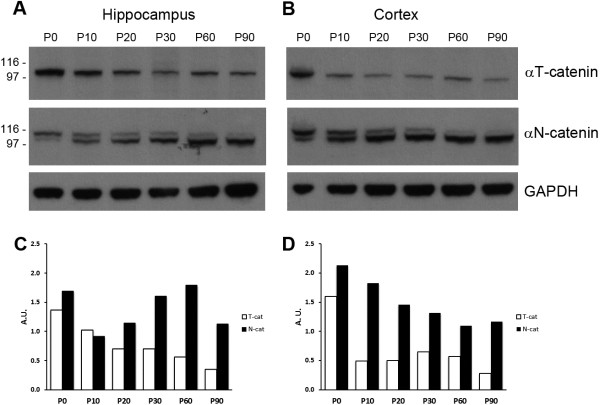
Figure 4.

Expression analysis of ctnna3 in mouse brain. Western blot analysis of αT-catenin and αN-catenin in mouse hippocampus (A) and cortex (B) at different developmental stages (from P0 to P90). (C, D) Histograms showing the band intensity normalised by GAPDH as internal loading control.
