
Figure 3.
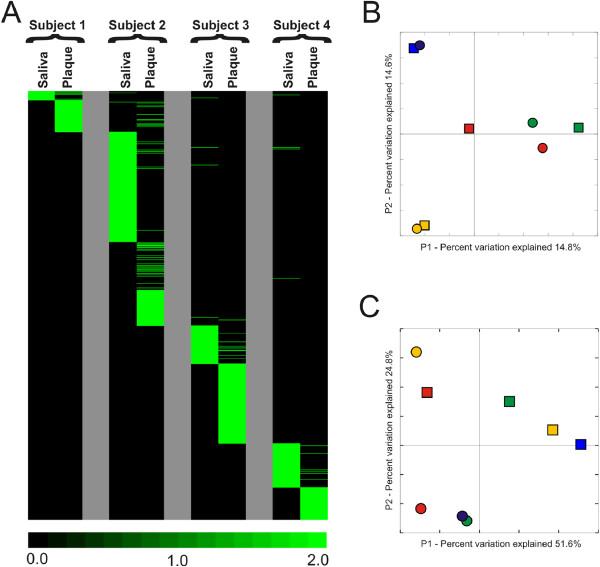
Heatmap of virome contigs (Panel A) and principal coordinates analysis of virome contigs (Panel B) and bacteria 16S rRNA (Panel C) from each subject and biogeographic site. Panel A - Each row represents a unique homologue, and the columns represent viromes from each subject and sample type. The intensity scale bar is located below the heatmap. In Panels B and C, subject #1 is represented in green, subject #2 in red, subject #3 in gold, and subject #4 in blue. Saliva is represented by squares and dental plaque by circles.