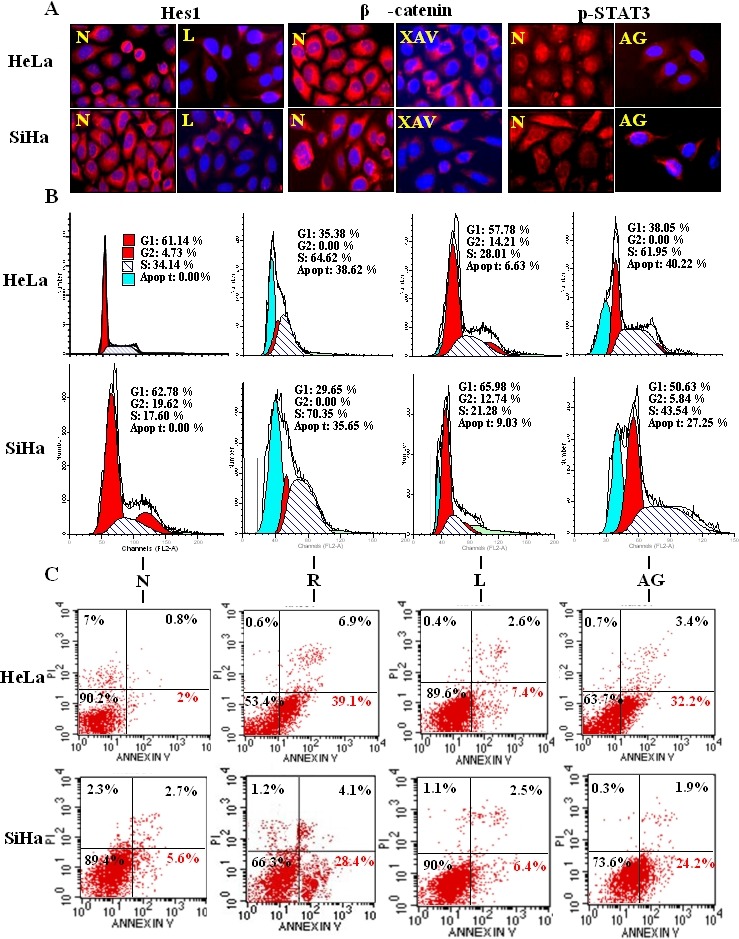
Figure 3. Evaluation of the effects of STAT3, Notch and Wnt selective inhibitors on HeLa and SiHa cells.

A: Immunofluorescent staining of Hes1 in HeLa and SiHa cells without (N) and with (L) 8 µM L685,458 treatment for 48h. Immunofluorescent staining of β-catenin in HeLa and SiHa cells without (N) and with (XAV) 10 μM XAV-939 treatment for 48h. Immunofluorescent staining of p-STAT3 in HeLa and SiHa cells without (N) and with (AG) 80 μM AG490 treatment for 48h. B: Flow cytometry analyses of cell cycle fractions in HeLa and SiHa cells. N: normal cultured cells, R: 100 μM resveratrol treated for 48h, L: 8 µM L685,458 treated for 48h, AG: 80 μM AG490 treated for 48h. C: Flow cytometry analyses of cell apoptosis fractions in HeLa and SiHa cells. PI/AnnexinV-FITC double staining. The percentage of each group of data was in the quadrant, UR: necrotic cells (FITC-/PI-), LL: viable cells (FITC+/PI+), LR: apoptotic cells (FITC+/PI-).
