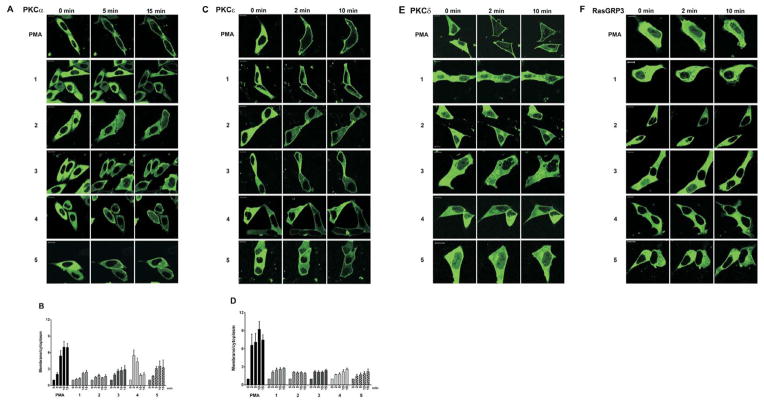
Figure 3.
Translocation of different PKC isoforms in living cells. CHO-K1 cells were transiently transfected with GFP-PKCα (A, B) and LNCaP cells were transiently transfected with YFP-PKCε (C, D), GFP- PKCδ (E), or GFP-RasGRP3 (F). The translocation pattern was examined by confocal microscopy as a function of time after treatment with the indicated drugs (10,000 nM) or PMA (1000 nM). Each panel represents images typical of the experiments performed (n = 3–6). Bars are 10 μm. Quantitative analysis of PKCα (B) and PKCε (D) translocation. Average ± SEM of calculated values are presented.

