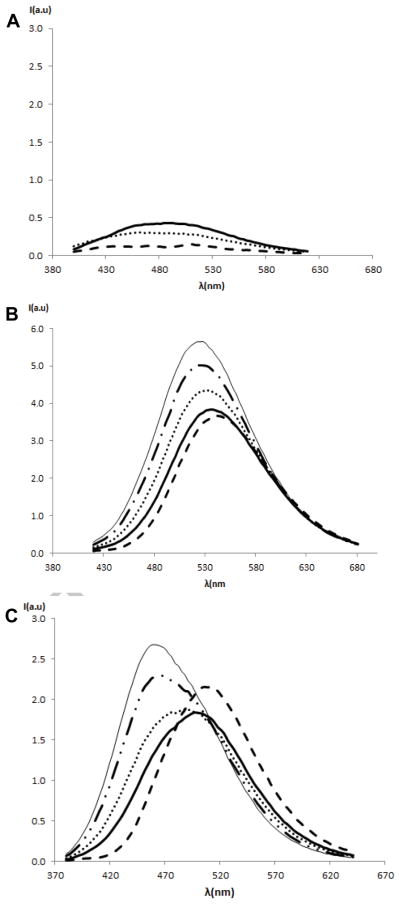
Figure 5.
Fluorescence emission spectra of DAG-indololactones 1 to 5 in the absence and in the presence of increasing concentration of giant vesicles. (a) Compounds 1 (- - -), 3 (····) and 5 (solid line); samples (6.05μM) in buffer in the presence DMPG/egg-PC giant vesicle solutions (30μL) in the scale of compound 4. Excitation wavelength = 358 nm, 343nm, 364 nm respectively; (b) Compound 2 (6.05μM), control sample (- - -) titrated with an increasing volume of DMPG/egg-PC giant vesicle solutions (5, 10, 20, 30μL). Excitation wavelength = 373 nm; (c) Compound 4 (6.05μM), control sample (- - -) titrated with an increasing volume of DMPG/egg-PC giant vesicle solutions (5, 10, 20, 30μL). Excitation wavelength = 349 nm.

