Figure 8.

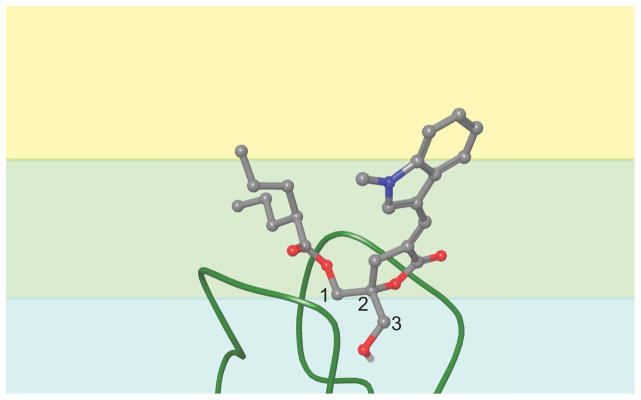
Cartoon representation of the C1 domain binding conformation of a DAG-indololactone. The carbon atoms in the glycerol backbone are numbered. The colored background represents the varying dielectric environments in the modeled bilayer: blue = lipid headgroups and water; green = ester groups and glycerol backbone; yellow = hydrophobic acyl chains.
