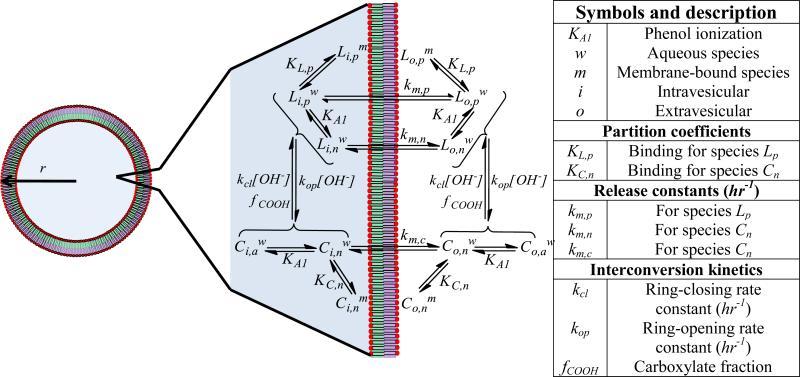
Scheme 2.
A schematic of the associated equilibria and kinetics governing liposomal release of TPT. The liposome depicted with radius, r, highlights the volume compartments described in the mathematical model. The different volume compartments are color coded with blue highlighting the inner aqueous volume, , while the green and violet sections refer to the inner, , and outer, , membrane volumes, respectively. The transport pathways and binding/ionization equilibria for all species illustrated in Scheme 1 are also depicted and described in the accompanying table (right).

