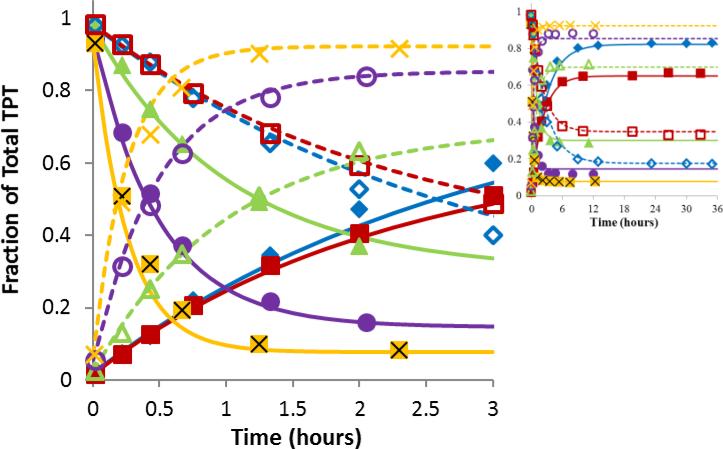
Fig 2.
Ring opening/closing kinetics of TPT as a function of pH. The plots display the fractions of total TPT in the lactone form (closed symbols) or carboxylate form (open symbols) versus time at the same pH of 5.92 ( ,
,  ), 6.33(
 ,
,  ), 7.04 (
 ,
,  ), 7.39 (
 ,
,  ), or 7.67 (x, X). The curves of matching color represent simultaneous fits of the kinetic interconversion model to the lactone (solid lines) and carboxylate (dashed lines) data. Most interconversion occurred within the first three hours while the inset shows that equilibrium was achieved.

