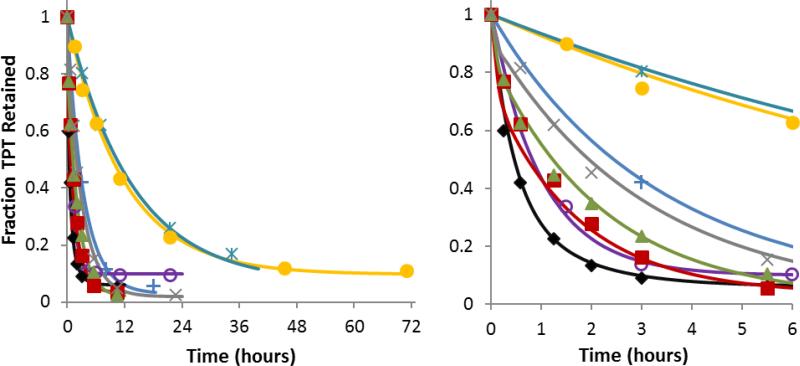
Fig 3.
Fraction of TPT retained in DSPC/DSPE-PEG2K liposomes vs. time at varying pH (right panel displays only the first 6 hrs). Release studies were conducted at pH 3.35  , 4.10
  , 5.10 +, 5.93
  , 6.33
  , 7.04
  , 7.39
  , and 7.67 x. The solid curves of the same color represent the simultaneous fit of the mechanism-based mathematical model developed in this paper to the entire data set.

