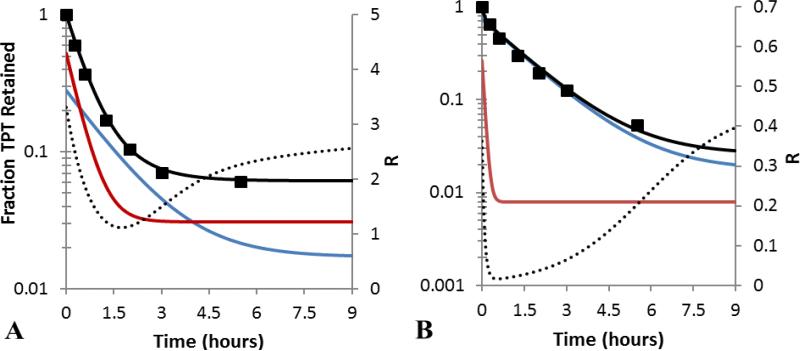
Fig 4.
Liposomal TPT release profiles at pH 6.33 (A) and 7.04 (B). The observed fraction of total TPT retained ( ) and the resulting fit to the model described within this paper (
 ) are shown. The simulated profiles of the lactone (
 ) and ring-opened (
 ) forms are also displayed to illustrate the rapid depletion of the lactone. The lactone to carboxylate ratio, R (
 ), is also shown to highlight the role of slow carboxylate → lactone conversion during TPT release.

