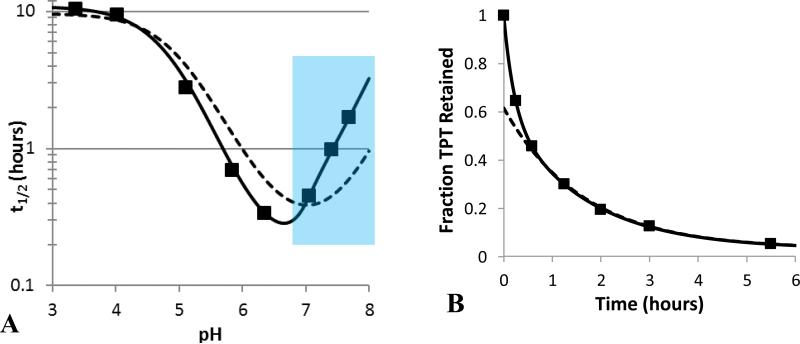
Fig 5.
(A) Comparison of the experimental pH profile of TPT release half-lives ( ) to model fits that account for the kinetics of lactone-carboxylate interconversion (
 ) or assume lactone-carboxylate equilibrium (
 ). The equilibrium model was unable to account for the steep changes in half-life in the neutral pH region. The blue section highlights the pH region in which release was slowed by greater than 25% due to rate-limiting ring-closure. (B) The biphasic release profile observed at pH 7.04 and the fits of models that either include interconversion kinetics (
 ) or assume interconversion equilibrium (
 ).
).

