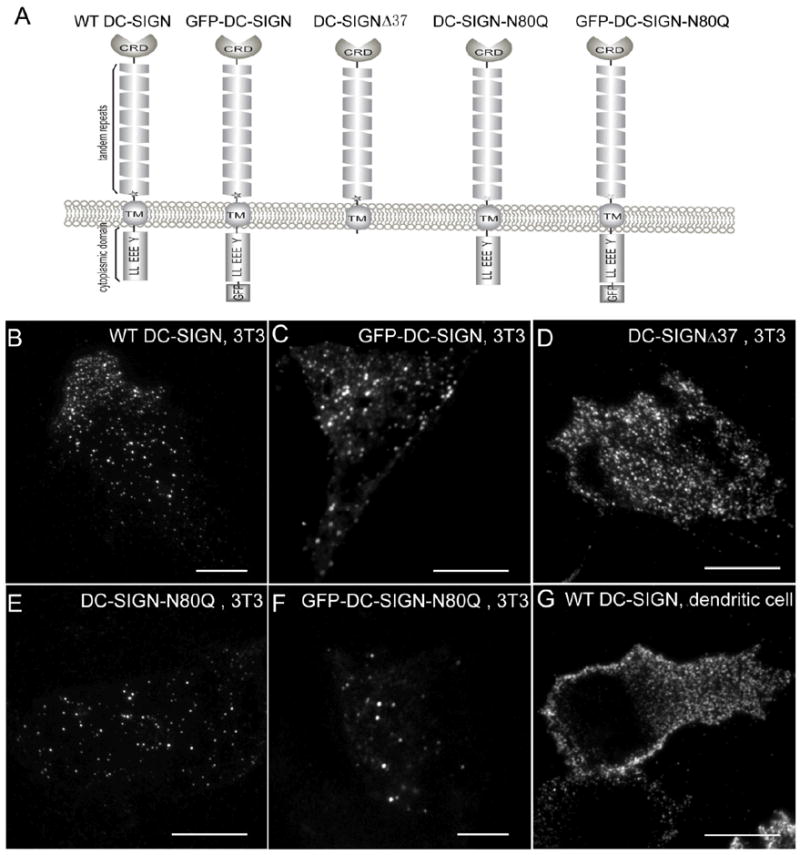
Figure 2. Constructs and sample cell images.

A) Schematic drawing of the different DC-SIGN constructs. B-F) Sample images of NIH3T3 cells expressing wt DC-SIGN (B), GFP-DC-SIGN (C), DC-SIGN-Δ37 (D), DC-SIGN-N80Q (E), and GFP-DC-SIGN-N80Q (F). G) A dendritic cell endogenously expressing DC-SIGN. Images were taken on a commercial Olympus objective-based TIRFM scope. Bars =10 μm.
