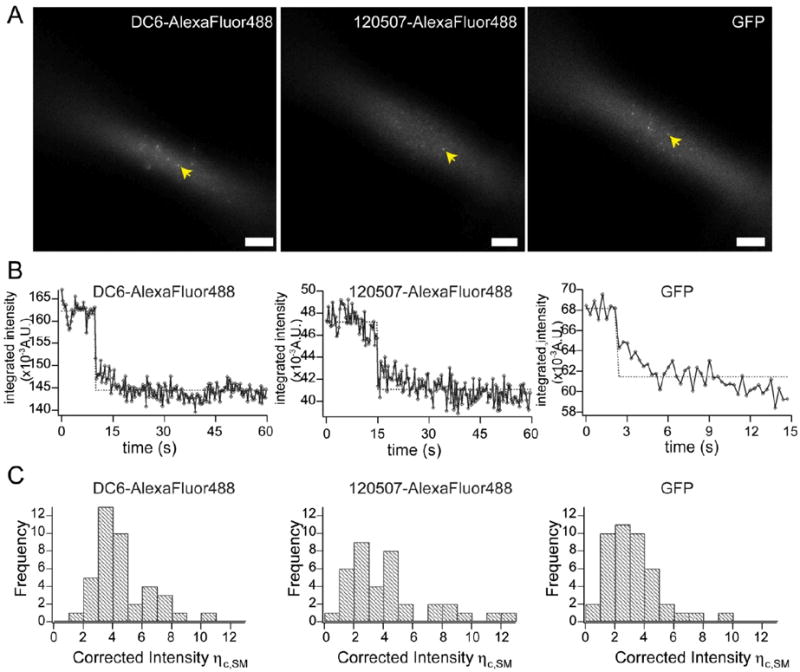
Figure 3. Determination of single-fluorophore brightnesses.

A) Sample images of single fluorophores (arrows) in prism-based TIRFM illumination. Left, single AlexaFluor488-conjugated DC6 mAb; middle, single AlexaFluor488-conjugated 120507 mAb; right, single GFP. B) Sample single-step photobleaching traces of single AlexaFluor488-conjugated DC6 mAb (left), single AlexaFluor488-conjugated 120507 mAb (middle), and single GFP (right). C) Histogram plots of the brightness distributions of single fluorophores. Left, single AlexaFluor488-conjugated DC6 mAb; middle, single AlexaFluor488-conjugated 120507 mAb; right, single GFP.
