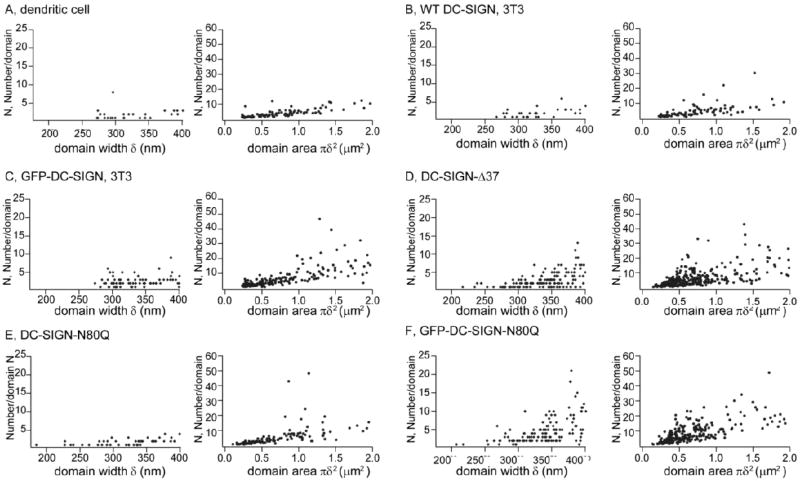
Figure 5. Scatter plots of numbers per domain vs domain width.

Left columns, scatter plots of numbers per domain with domain width δ < 400 nm. Right columns, scatter plots of numbers per domain vs domain area for the entire range of domain sizes. A) DC-SIGN in dendritic cells. B-F) NIH3T3 cells expressing wt DC-SIGN (B), GFP-DC-SIGN (C), DC-SIGN-Δ37 (D), DC-SIGN-N80Q (E), and GFP-DC-SIGN-N80Q (F).
