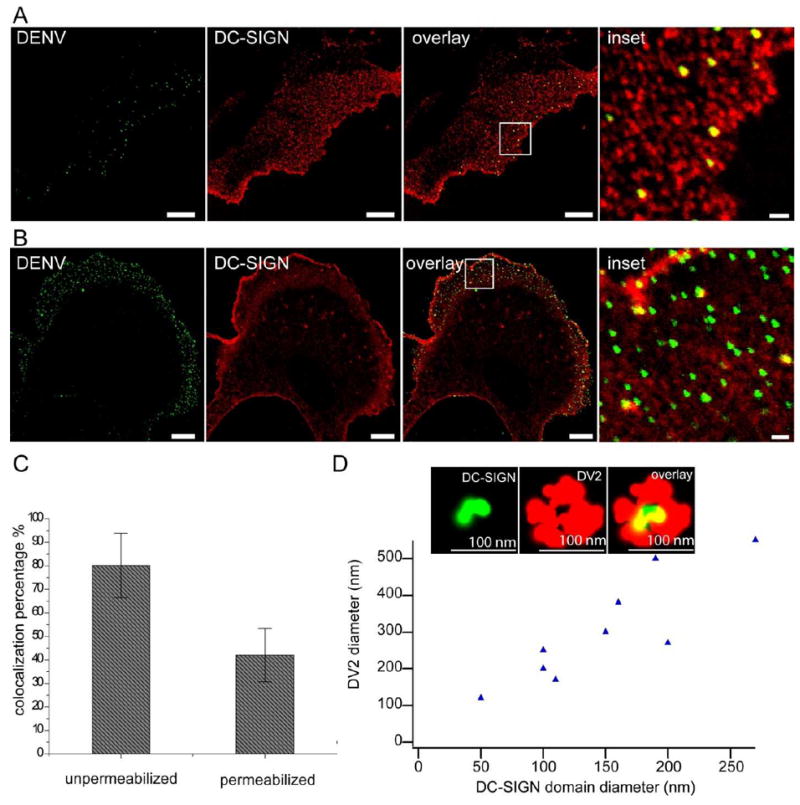
Figure 6. Colocalization of DENVs with DC-SIGN micro/nano-domains.

A) Representative confocal images of DENVs (left), DC-SIGN microdomains (middle left), overlay of the two (middle right), and an enlarged view of the inset in middle right (right), on cell surfaces. In this experiment, NIH3T3 cells expressing DC-SIGN were pretreated with endocytosis inhibitors (10 mM NaN3, 2 mM NaF, and 5 mM 2-deoxy-D-glucose) for 2 min, then incubated with DENV for 10 minutes prior to fixation. B) Representative confocal images of DENVs (left), DC-SIGN microdomains (middle left), and overlay of the two (middle right), and an enlarged view of the inset in middle right (right), after cell permeabilization. Bars in the first three panels, 10 μm. Bar in the fourth panel, 1 μm; in this experiment, DENV was incubated with 3T3 cells expressing DC-SIGN for 15 minutes prior to fixation and permeabilization. C) Colocalization percentages of DENVs with DC-SIGN microdomains before (left bar) and after (right bar) permeabilization. Error bar, standard deviation. D) Plot of DC-SIGN micro/nano-domain diameters with corresponding colocalized DENV (single or aggregates) diameters, from dSTORM images. Inset, a representative dSTORM image of a single DC-SIGN nanodomain (left), DENV particle (middle) and overlay of the two (right). Bars, 100 nm.
