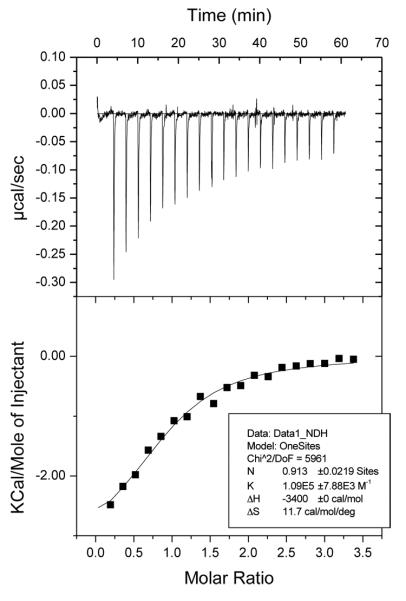
Figure 2.

Titration of PPARγ (50 μM) with resveratrol (500 μM). The upper panels show the raw data, the lower panels show the corresponding binding isotherm fitted according to the “one binding site” model. The thermodynamic parameters (Kd, ΔH and ΔS) are indicated in the boxes.
